AP®︎ Precalculus: Unit 1 Practice Test
Prepare for your quiz, test, or the AP exam with focused practice questions on Unit 1 of AP Precalculus – Polynomial and Rational Functions.
Questions List
Unit 1 (All Topics)
Question 1 Topic 1.1Easy
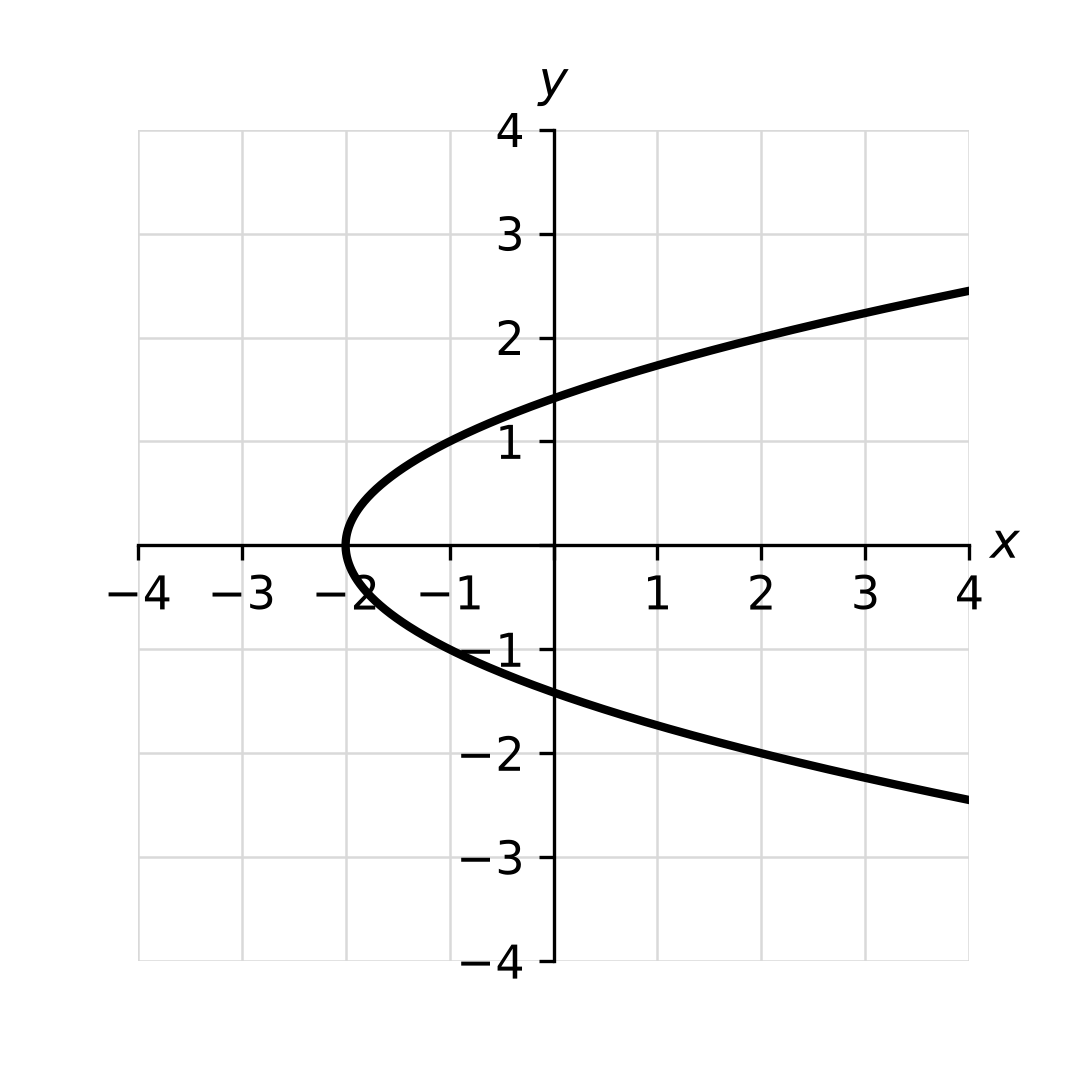
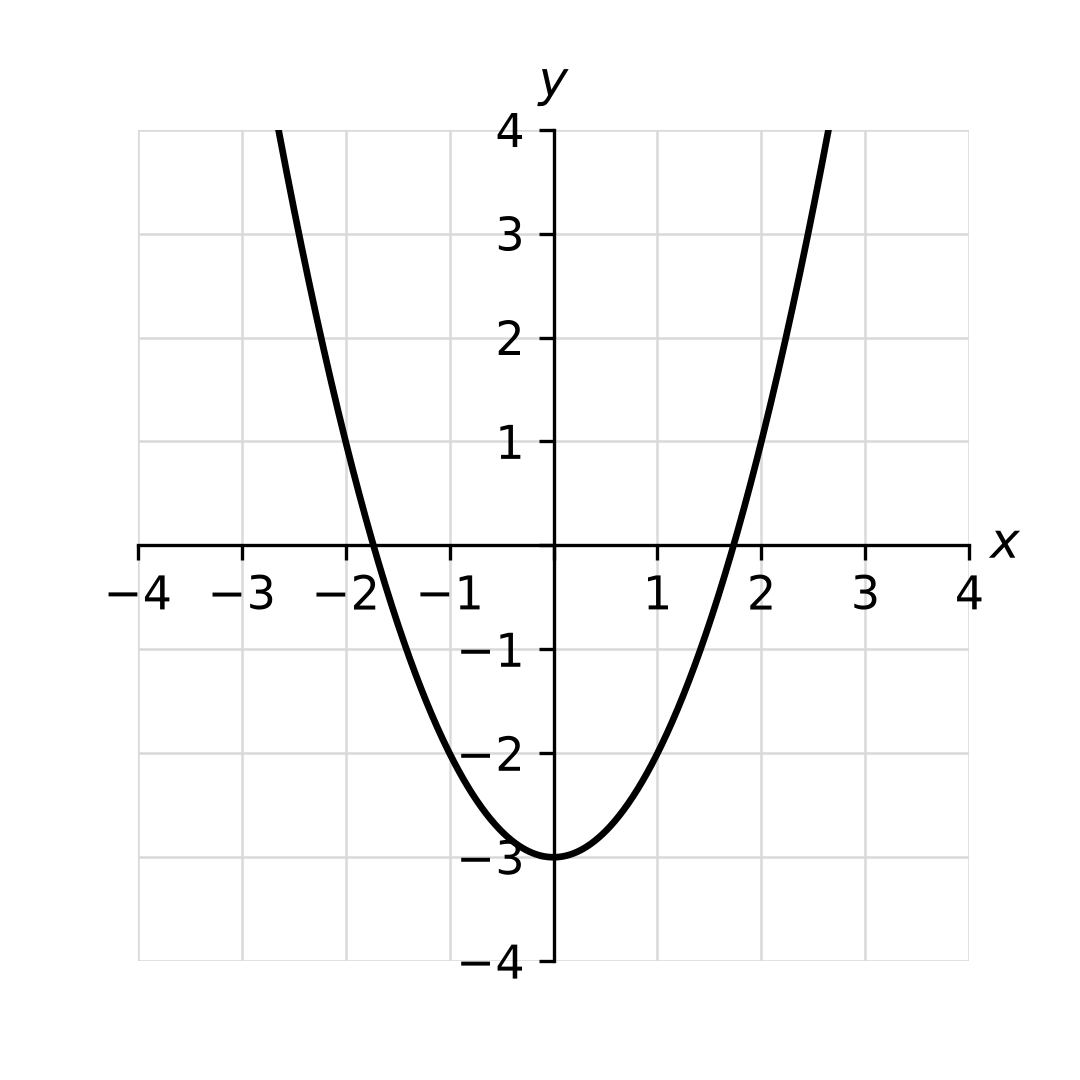
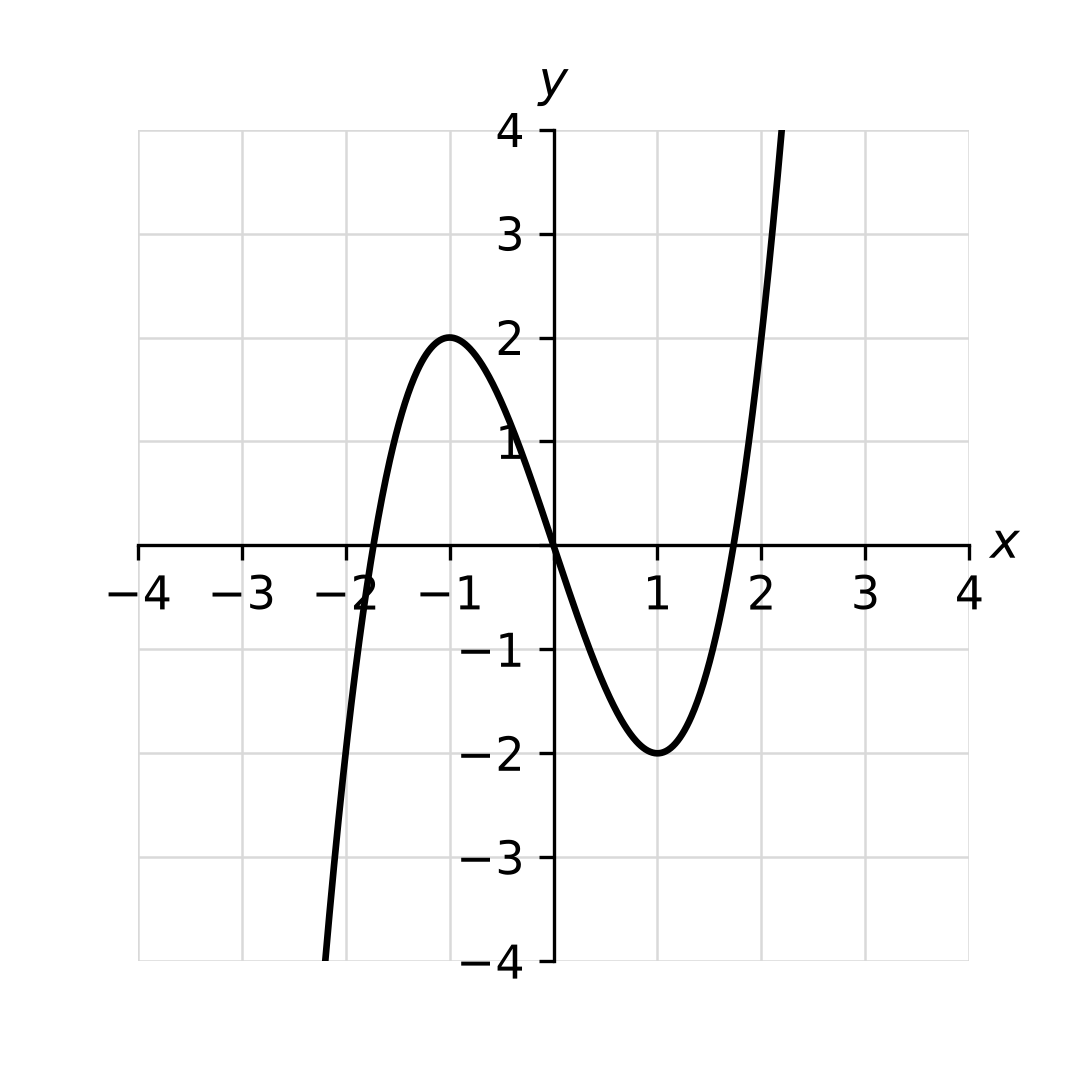
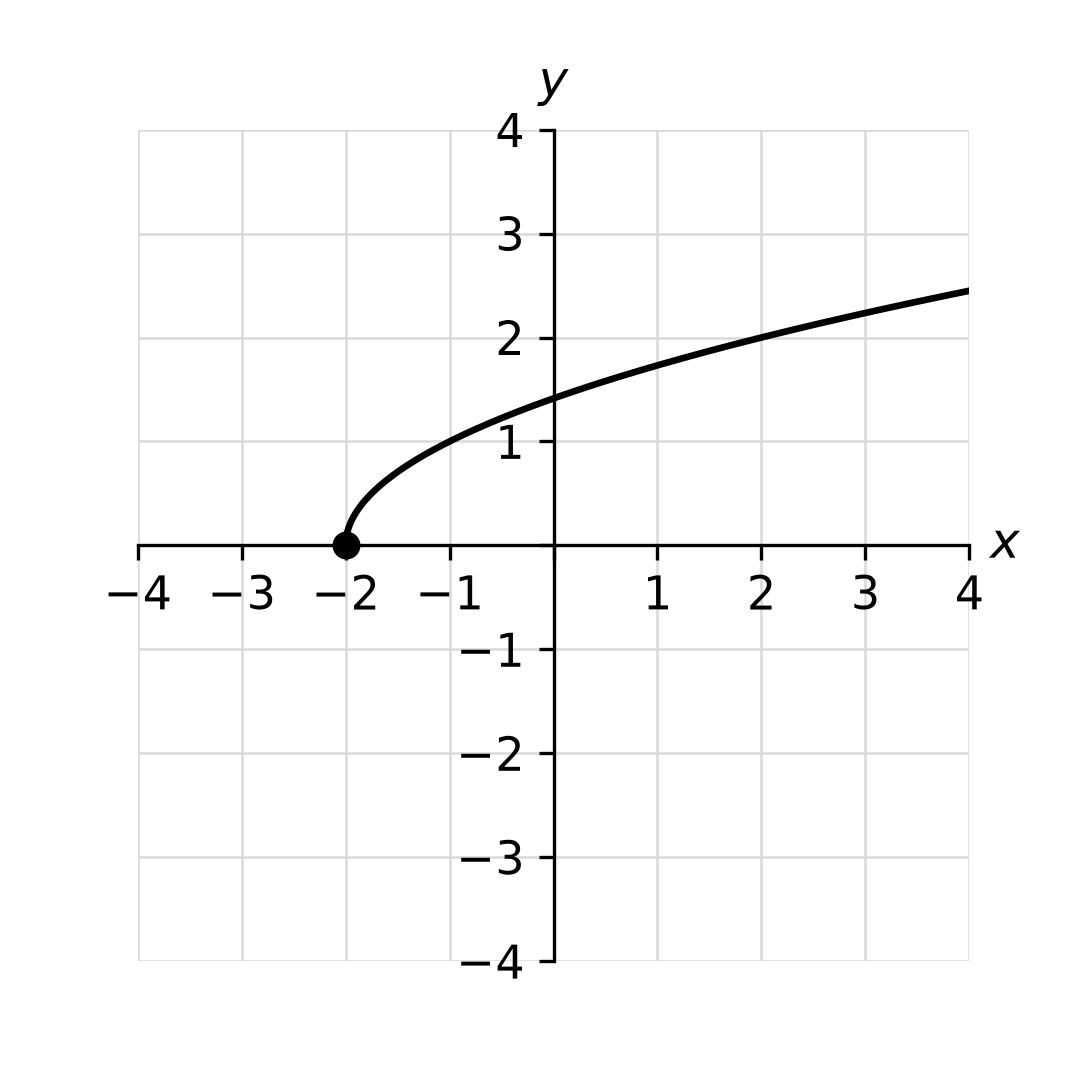
Which of the following graphs does NOT represent as a function of ?
What You’re Being Tested On:
Explore the learning objectives taken directly from the College Board’s AP® Precalculus Curriculum. Ensure you’re prepared for the exact topics covered on the AP® exam, in-class tests, and quizzes, and gain confidence in your mastery of the material.
Unit 1: Polynomial and Rational Functions
This unit develops understanding of polynomial and rational functions by analyzing their behavior, key features like asymptotes and end behavior, and how they can model relationships between changing quantities.

Topic 1.1: Change in Tandem
Learning Objective: 1.1.A
Describe how the input and output values of a function vary together by comparing function values.
Essential Knowledge: 1.1.A.1
A function is a mathematical relation that maps a set of input values to a set of output values such that each input value is mapped to exactly one output value. The set of input values is called the domain of the function, and the set of output values is called the range of the function. The variable representing input values is called the independent variable, and the variable representing output values is called the dependent variable. Two functions, and , are equal if they have the same domain, and for every input value in that same domain, both functions yield the same output value ().
Essential Knowledge: 1.1.A.2
The input and output values of a function vary in tandem according to the function rule, which can be expressed graphically, numerically, analytically, or verbally. The image of an input value is the single output value yielded by the function rule. The preimage of an output value is the set of input values for which the function rule yields that output value.
Essential Knowledge: 1.1.A.3
A function is increasing over an interval of its domain if, as the input values increase, the output values always increase. That is, for all and in the interval, if , then .
Essential Knowledge: 1.1.A.4
A function is decreasing over an interval of its domain if, as the input values increase, the output values always decrease. That is, for all and in the interval, if , then . Exclusion: Discriminating between open intervals and closed intervals as it relates to intervals on which a function is increasing or intervals on which a function is decreasing is outside the scope of the AP Precalculus course and exam.
Learning Objective: 1.1.B
Construct a graph representing two quantities that vary with respect to each other in a contextual scenario.
Essential Knowledge: 1.1.B.1
The graph of a function displays a set of input-output pairs and shows how the values of the function’s input and output values vary.
Essential Knowledge: 1.1.B.2
A verbal description of the way aspects of phenomena change together can be the basis for constructing a graph.
Essential Knowledge: 1.1.B.3
The graph of a function is concave up on intervals in which the rate of change is increasing.
Essential Knowledge: 1.1.B.4
The graph of a function is concave down on intervals in which the rate of change is decreasing.
Essential Knowledge: 1.1.B.5
The graph intersects the -axis when the output value is zero. The corresponding input values are said to be zeros of the function.
Topic 1.2: Rates of Change
Learning Objective: 1.2.A
Compare the rates of change at two points using average rates of change near the points.
Essential Knowledge: 1.2.A.1
The average rate of change of a function over an interval of the function’s domain is the constant rate of change that yields the same change in the output values as the function yielded on that interval of the function’s domain. It is the ratio of the change in the output values to the change in input values over that interval.
Essential Knowledge: 1.2.A.2
The rate of change of a function at a point quantifies the rate at which output values would change were the input values to change at that point. The rate of change at a point can be approximated by the average rates of change of the function over small intervals containing the point, if such values exist.
Essential Knowledge: 1.2.A.3
The rates of change at two points can be compared using average rate of change approximations over sufficiently small intervals containing each point, if such values exist.
Learning Objective: 1.2.B
Describe how two quantities vary together at different points and over different intervals of a function.
Essential Knowledge: 1.2.B.1
Rates of change quantify how two quantities vary together.
Essential Knowledge: 1.2.B.2
A positive rate of change indicates that as one quantity increases or decreases, the other quantity does the same.
Essential Knowledge: 1.2.B.3
A negative rate of change indicates that as one quantity increases, the other decreases.
Topic 1.3: Rates of Change in Linear and Quadratic Functions
Learning Objective: 1.3.A
Determine the average rates of change for sequences and functions, including linear, quadratic, and other function types.
Essential Knowledge: 1.3.A.1
For a linear function, the average rate of change over any length input-value interval is constant.
Essential Knowledge: 1.3.A.2
For a quadratic function, the average rates of change over consecutive equal-length input-value intervals can be given by a linear function.
Essential Knowledge: 1.3.A.3
The average rate of change of a function over the closed interval is the slope of the secant line from the point to .
Learning Objective: 1.3.B
Determine the change in the average rates of change for linear, quadratic, and other function types.
Essential Knowledge: 1.3.B.1
For a linear function, since the average rates of change over consecutive equal-length input-value intervals can be given by a constant function, these average rates of change for a linear function are changing at a rate of zero.
Essential Knowledge: 1.3.B.2
For a quadratic function, since the average rates of change over consecutive equal-length input-value intervals can be given by a linear function, these average rates of change for a quadratic function are changing at a constant rate.
Essential Knowledge: 1.3.B.3
When the average rate of change over equal-length input-value intervals is increasing for all small-length intervals, the graph of the function is concave up. When the average rate of change over equal-length input-value intervals is decreasing for all small-length intervals, the graph of the function is concave down.
Topic 1.4: Polynomial Functions and Rates of Change
Learning Objective: 1.4.A
Identify key characteristics of polynomial functions related to rates of change.
Essential Knowledge: 1.4.A.1
A nonconstant polynomial function of is any function representation that is equivalent to the analytical form , where is a positive integer, is a real number for each from 0 to , and is nonzero. The polynomial has degree , the leading term is , and the leading coefficient is . A nonzero constant is also a polynomial function of degree zero.
Essential Knowledge: 1.4.A.2
Where a polynomial function switches between increasing and decreasing, or at the included endpoint of a polynomial with a restricted domain, the polynomial function will have a local, or relative, maximum or minimum output value. If any local maximum is greater than all other function output values, then that local maximum is a global, or absolute, maximum. Similarly, if any local minimum is less than all other function output values, then that local minimum is a global, or absolute, minimum.
Essential Knowledge: 1.4.A.3
Between every two distinct real zeros of a nonconstant polynomial function, there must be at least one input value corresponding to a local maximum or local minimum.
Essential Knowledge: 1.4.A.4
A polynomial function of even degree has either a global maximum or a global minimum. For a quadratic function, the global maximum or global minimum occurs at the vertex.
Essential Knowledge: 1.4.A.5
Points of inflection of a polynomial function occur at input values where the rate of change of the function changes from increasing to decreasing or from decreasing to increasing. This occurs where the graph of a polynomial function changes from concave up to concave down or from concave down to concave up.
Topic 1.5: Polynomial Functions and Complex Zeros
Learning Objective: 1.5.A
Identify key characteristics of a polynomial function related to its zeros when suitable factorizations are available or with technology.
Essential Knowledge: 1.5.A.1
If is a complex number and , then is called a zero of the polynomial function , or a root of . If is a real number, then is a linear factor of if and only if is a zero of .
Essential Knowledge: 1.5.A.2
If a linear factor is repeated times, the corresponding zero of the polynomial function has a multiplicity . A polynomial function of degree has exactly complex zeros when counting multiplicities.
Essential Knowledge: 1.5.A.3
If is a real zero of a polynomial function , then the graph of has an -intercept at the point . Consequently, real zeros of a polynomial can be endpoints for intervals satisfying polynomial inequalities.
Essential Knowledge: 1.5.A.4
If is a non-real zero of a polynomial function , then its conjugate is also a zero of .
Essential Knowledge: 1.5.A.5
If the real zero, , of a polynomial function has even multiplicity, then the signs of the output values are the same for input values near . For these polynomial functions, the graph will be tangent to the -axis at .
Essential Knowledge: 1.5.A.6
The degree of a polynomial function can be found by examining the successive differences of the output values over equal-interval input values. The degree of the polynomial function is equal to the least value for which the successive th differences are constant.
Learning Objective: 1.5.B
Determine if a polynomial function is even or odd.
Essential Knowledge: 1.5.B.1
An even function is graphically symmetric over the line and analytically has the property . If is even, then a polynomial of the form , where and , is an even function.
Essential Knowledge: 1.5.B.2
An odd function is graphically symmetric about the point and analytically has the property . If is odd, then a polynomial of the form , where and , is an odd function.
Topic 1.6: Polynomial Functions and End Behavior
Learning Objective: 1.6.A
Describe end behaviors of polynomial functions.
Essential Knowledge: 1.6.A.1
As input values of a nonconstant polynomial function increase without bound, the output values will either increase or decrease without bound. The corresponding mathematical notation is or .
Essential Knowledge: 1.6.A.2
As input values of a nonconstant polynomial function decrease without bound, the output values will either increase or decrease without bound. The corresponding mathematical notation is or .
Essential Knowledge: 1.6.A.3
The degree and sign of the leading term of a polynomial determines the end behavior of the polynomial function, because as the input values increase or decrease without bound, the values of the leading term dominate the values of all lower-degree terms.
Topic 1.7: Rational Functions and End Behavior
Learning Objective: 1.7.A
Describe end behaviors of rational functions.
Essential Knowledge: 1.7.A.1
A rational function is analytically represented as a quotient of two polynomial functions and gives a measure of the relative size of the polynomial function in the numerator compared to the polynomial function in the denominator for each value in the rational function’s domain.
Essential Knowledge: 1.7.A.2
The end behavior of a rational function will be affected most by the polynomial with the greater degree, as its values will dominate the values of the rational function for input values of large magnitude. For input values of large magnitude, a polynomial is dominated by its leading term. Therefore, the end behavior of a rational function can be understood by examining the corresponding quotient of the leading terms.
Essential Knowledge: 1.7.A.3
If the polynomial in the numerator dominates the polynomial in the denominator for input values of large magnitude, then the quotient of the leading terms is a nonconstant polynomial, and the original rational function has the end behavior of that polynomial. If that polynomial is linear, then the graph of the rational function has a slant asymptote parallel to the graph of the line.
Essential Knowledge: 1.7.A.4
If neither polynomial in a rational function dominates the other for input values of large magnitude, then the quotient of the leading terms is a constant, and that constant indicates the location of a horizontal asymptote of the graph of the original rational function.
Essential Knowledge: 1.7.A.5
If the polynomial in the denominator dominates the polynomial in the numerator for input values of large magnitude, then the quotient of the leading terms is a rational function with a constant in the numerator and nonconstant polynomial in the denominator, and the graph of the original rational function has a horizontal asymptote at .
Essential Knowledge: 1.7.A.6
When the graph of a rational function has a horizontal asymptote at , where is a constant, the output values of the rational function get arbitrarily close to and stay arbitrarily close to as input values increase or decrease without bound. The corresponding mathematical notation is or .
Topic 1.8: Rational Functions and Zeros
Learning Objective: 1.8.A
Determine the zeros of rational functions.
Essential Knowledge: 1.8.A.1
The real zeros of a rational function correspond to the real zeros of the numerator for such values in its domain.
Essential Knowledge: 1.8.A.2
The real zeros of both polynomial functions of a rational function are endpoints or asymptotes for intervals satisfying the rational function inequalities or .
Topic 1.9: Rational Functions and Vertical Asymptotes
Learning Objective: 1.9.A
Determine vertical asymptotes of graphs of rational functions.
Essential Knowledge: 1.9.A.1
If the value is a real zero of the polynomial function in the denominator of a rational function and is not also a real zero of the polynomial function in the numerator, then the graph of the rational function has a vertical asymptote at . Furthermore, a vertical asymptote also occurs at if the multiplicity of as a real zero in the denominator is greater than its multiplicity as a real zero in the numerator.
Essential Knowledge: 1.9.A.2
Near a vertical asymptote, , of a rational function, the values of the polynomial function in the denominator are arbitrarily close to zero, so the values of the rational function increase or decrease without bound. The corresponding mathematical notation is or for input values near and greater than , and or for input values near and less than .
Topic 1.10: Rational Functions and Holes
Learning Objective: 1.10.A
Determine holes in graphs of rational functions.
Essential Knowledge: 1.10.A.1
If the multiplicity of a real zero in the numerator is greater than or equal to its multiplicity in the denominator, then the graph of the rational function has a hole at the corresponding input value.
Essential Knowledge: 1.10.A.2
If the graph of a rational function has a hole at , then the location of the hole can be determined by examining the output values corresponding to input values sufficiently close to . If input values sufficiently close to correspond to output values arbitrarily close to , then the hole is located at the point with coordinates . The corresponding mathematical notation is . It should be noted that .
Topic 1.11: Equivalent Representations of Polynomial and Rational Expressions
Learning Objective: 1.11.A
Rewrite polynomial and rational expressions in equivalent forms.
Essential Knowledge: 1.11.A.1
Because the factored form of a polynomial or rational function readily provides information about real zeros, it can reveal information about -intercepts, asymptotes, holes, domain, and range.
Essential Knowledge: 1.11.A.2
The standard form of a polynomial or rational function can reveal information about end behaviors of the function.
Essential Knowledge: 1.11.A.3
The information extracted from different analytic representations of the same polynomial or rational function can be used to answer questions in context.
Learning Objective: 1.11.B
Determine the quotient of two polynomial functions using long division.
Essential Knowledge: 1.11.B.1
Polynomial long division is an algebraic process similar to numerical long division involving a quotient and remainder. If the polynomial is divided by the polynomial , then can be rewritten as , where is the quotient, is the remainder, and the degree of is less than the degree of .
Essential Knowledge: 1.11.B.2
The result of polynomial long division is helpful in finding equations of slant asymptotes for graphs of rational functions.
Learning Objective: 1.11.C
Rewrite the repeated product of binomials using the binomial theorem.
Essential Knowledge: 1.11.C.1
The binomial theorem utilizes the entries in a single row of Pascal’s Triangle to more easily expand expressions of the form , including polynomial functions of the form , where is a constant.
Topic 1.12: Transformations of Functions
Learning Objective: 1.12.A
Construct a function that is an additive and/or multiplicative transformation of another function.
Essential Knowledge: 1.12.A.1
The function is an additive transformation of the function that results in a vertical translation of the graph of by units.
Essential Knowledge: 1.12.A.2
The function is an additive transformation of the function that results in a horizontal translation of the graph of by units.
Essential Knowledge: 1.12.A.3
The function , where , is a multiplicative transformation of the function that results in a vertical dilation of the graph of by a factor of . If , the transformation involves a reflection over the -axis.
Essential Knowledge: 1.12.A.4
The function , where , is a multiplicative transformation of the function that results in a horizontal dilation of the graph of by a factor of . If , the transformation involves a reflection over the -axis.
Essential Knowledge: 1.12.A.5
Additive and multiplicative transformations can be combined, resulting in combinations of horizontal and vertical translations and dilations. The set of points prior to the transformations is called the preimage of the transformations, and the set of points after the transformations is called the image of the transformations.
Essential Knowledge: 1.12.A.6
The domain and range of a function that is a transformation of a parent function may be different from those of the parent function.
Topic 1.13: Function Model Selection and Assumption Articulation
Learning Objective: 1.13.A
Identify an appropriate function type to construct a function model for a given scenario.
Essential Knowledge: 1.13.A.1
Linear functions model data sets or aspects of contextual scenarios that demonstrate roughly constant rates of change.
Essential Knowledge: 1.13.A.2
Quadratic functions model data sets or aspects of contextual scenarios that demonstrate roughly linear rates of change, or data sets that are roughly symmetric with a unique maximum or minimum value.
Essential Knowledge: 1.13.A.3
Geometric contexts involving area or two dimensions can often be modeled by quadratic functions. Geometric contexts involving volume or three dimensions can often be modeled by cubic functions.
Essential Knowledge: 1.13.A.4
Polynomial functions model data sets or contextual scenarios with multiple real zeros or multiple maxima or minima.
Essential Knowledge: 1.13.A.5
A polynomial function of degree models data sets or contextual scenarios that demonstrate roughly constant nonzero th differences.
Essential Knowledge: 1.13.A.6
A polynomial function of degree or less can be used to model a graph of points with distinct input values.
Essential Knowledge: 1.13.A.7
A piecewise-defined function consists of a set of functions defined over nonoverlapping domain intervals and is useful for modeling a data set or contextual scenario that demonstrates different characteristics over different intervals.
Learning Objective: 1.13.B
Describe assumptions and restrictions related to building a function model.
Essential Knowledge: 1.13.B.1
A model may have underlying assumptions about what is consistent in the model.
Essential Knowledge: 1.13.B.2
A model may have underlying assumptions about how quantities change together.
Essential Knowledge: 1.13.B.3
A model may require domain restrictions based on mathematical clues, contextual clues, or extreme values in the data set.
Essential Knowledge: 1.13.B.4
A model may require range restrictions, such as rounding values, based on mathematical clues, contextual clues, or extreme values in the data set.
Topic 1.14: Function Model Construction and Application
Learning Objective: 1.14.A
Construct a linear, quadratic, cubic, quartic, polynomial of degree \(n\), or related piecewise-defined function model.
Essential Knowledge: 1.14.A.1
A model can be constructed based on restrictions identified in a mathematical or contextual scenario.
Essential Knowledge: 1.14.A.2
A model of a data set or a contextual scenario can be constructed using transformations of the parent function.
Essential Knowledge: 1.14.A.3
A model of a data set can be constructed using technology and regressions, including linear, quadratic, cubic, and quartic regressions.
Essential Knowledge: 1.14.A.4
A piecewise-defined function model can be constructed through a combination of modeling techniques.
Learning Objective: 1.14.B
Construct a rational function model based on a context.
Essential Knowledge: 1.14.B.1
Data sets and aspects of contextual scenarios involving quantities that are inversely proportional can often be modeled by rational functions. For example, the magnitudes of both gravitational force and electromagnetic force between objects are inversely proportional to the objects’ squared distance.
Learning Objective: 1.14.C
Apply a function model to answer questions about a data set or contextual scenario.
Essential Knowledge: 1.14.C.1
A model can be used to draw conclusions about the modeled data set or contextual scenario, including answering key questions and predicting values, rates of change, average rates of change, and changing rates of change. Appropriate units of measure should be extracted or inferred from the given context.
