AP®︎ Precalculus: Topic 1.1 Practice Test
Prepare for your quiz, test, or the AP exam with focused practice questions on Topic 1.1 of AP Precalculus – Change in Tandem.
Questions List
Topic 1.1
Question 1 Easy
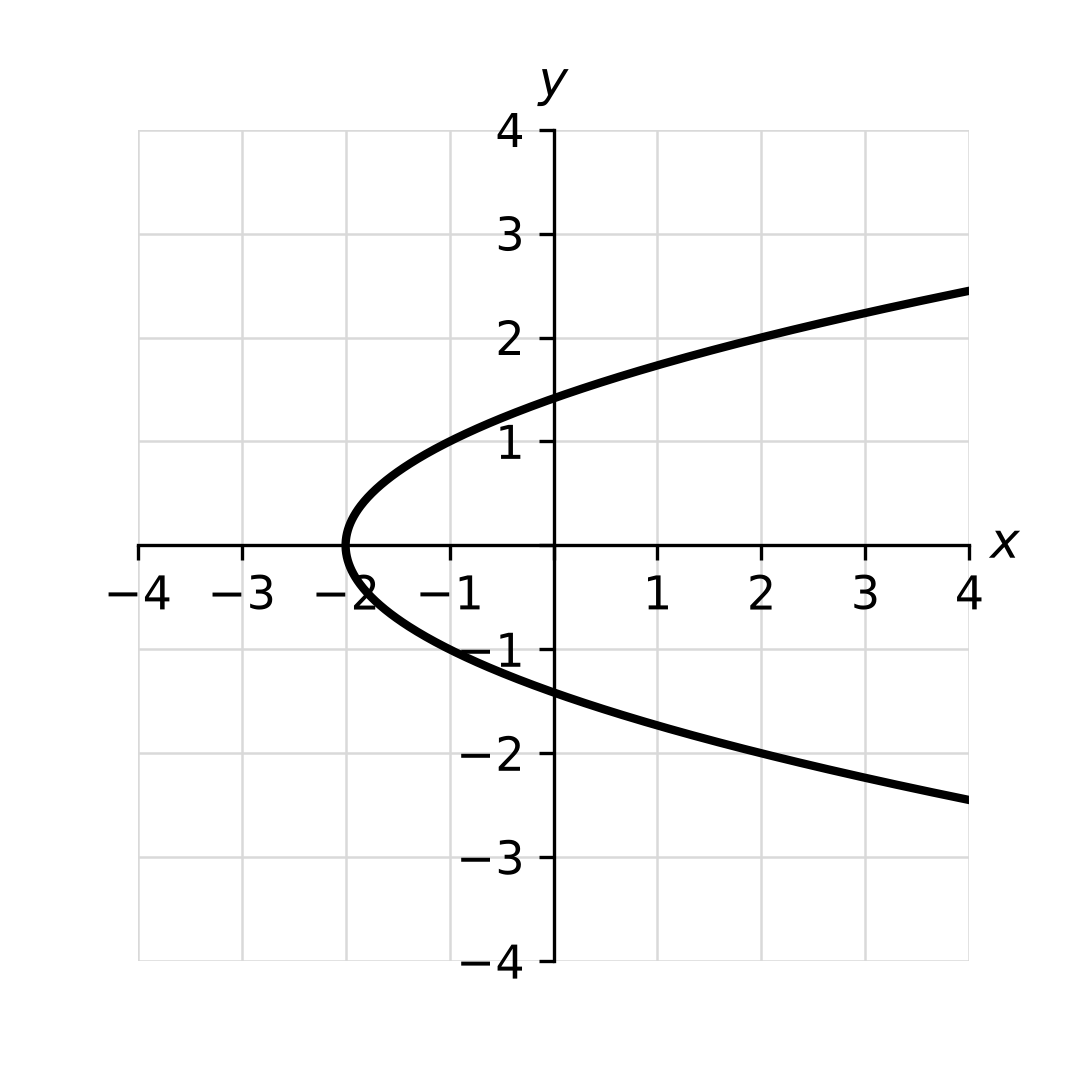
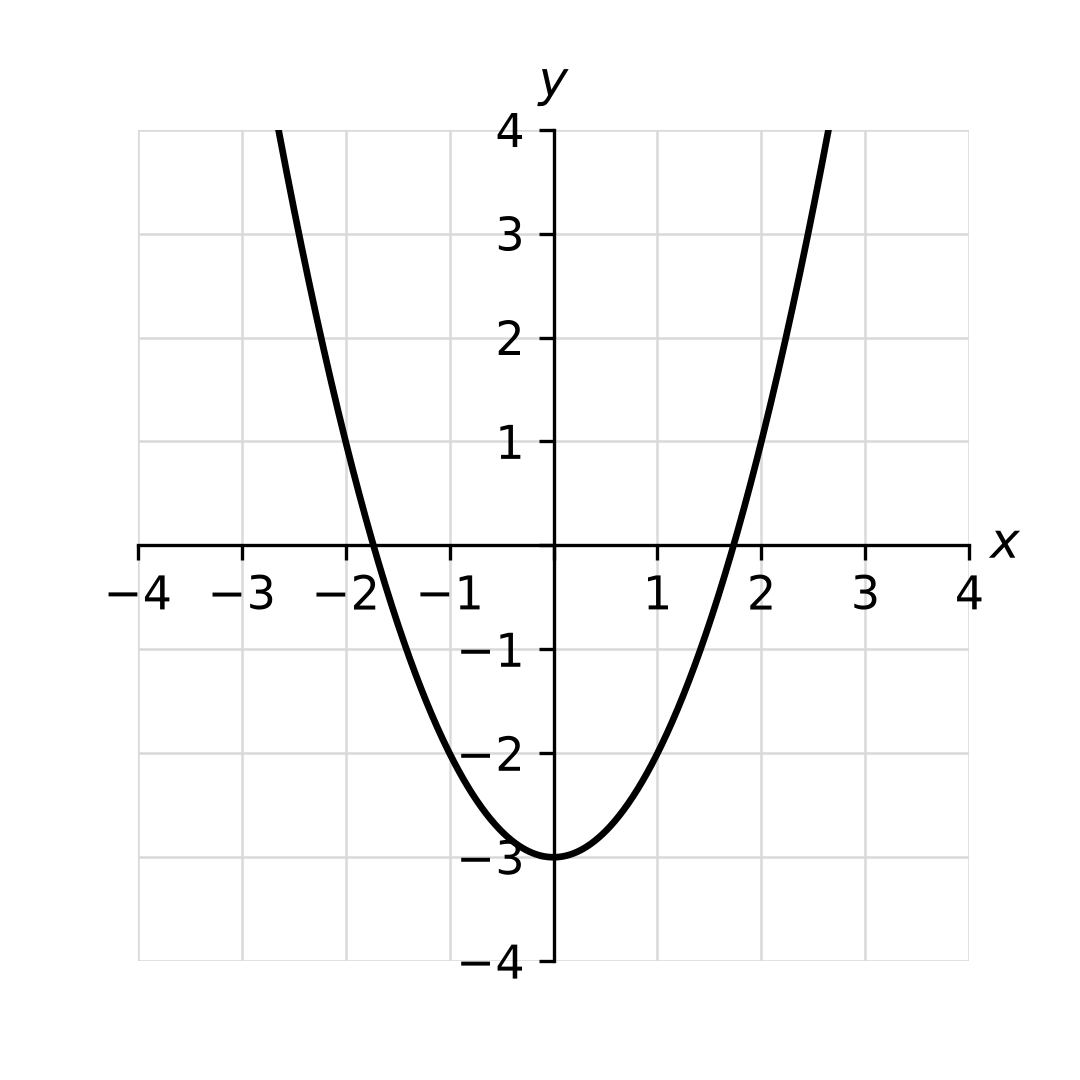
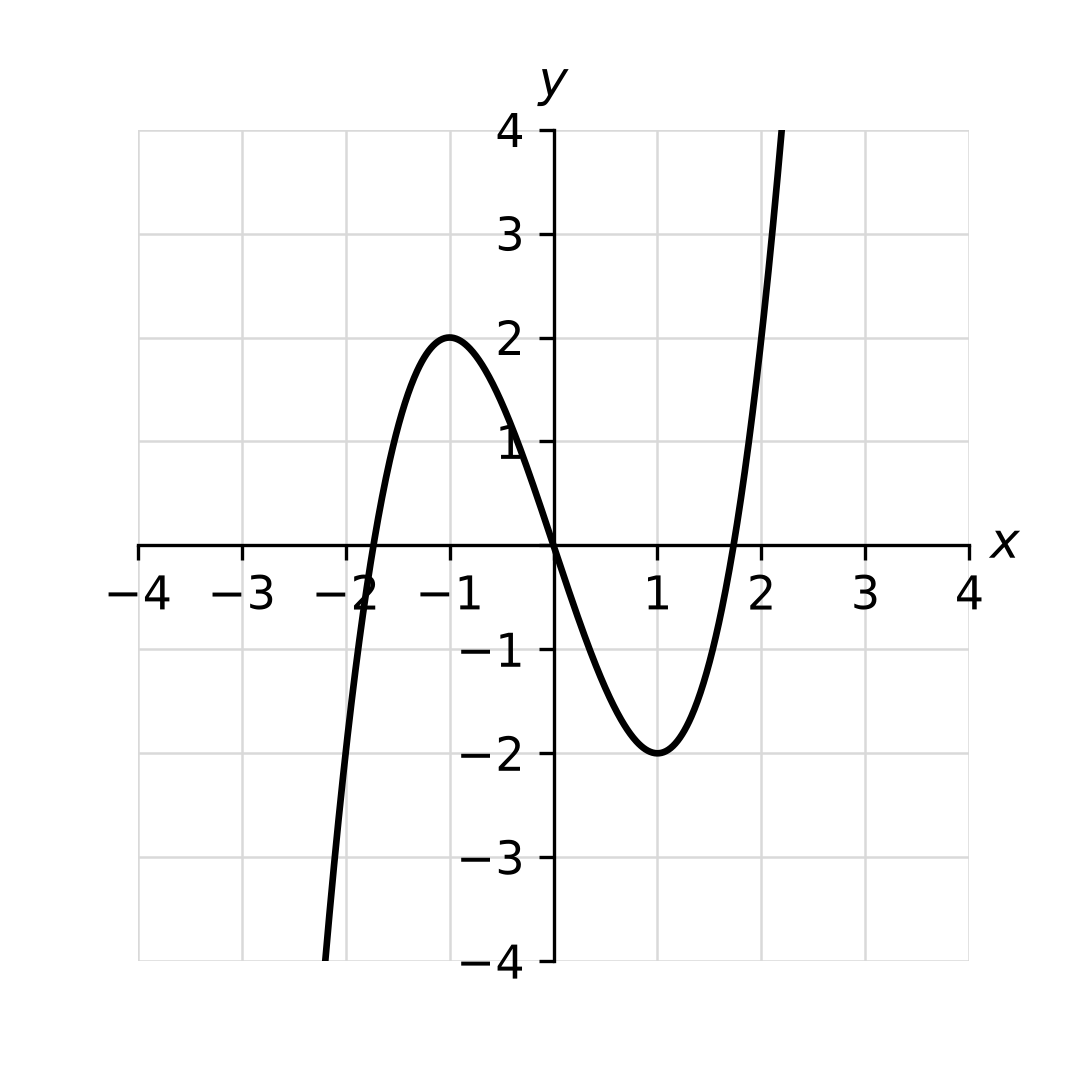
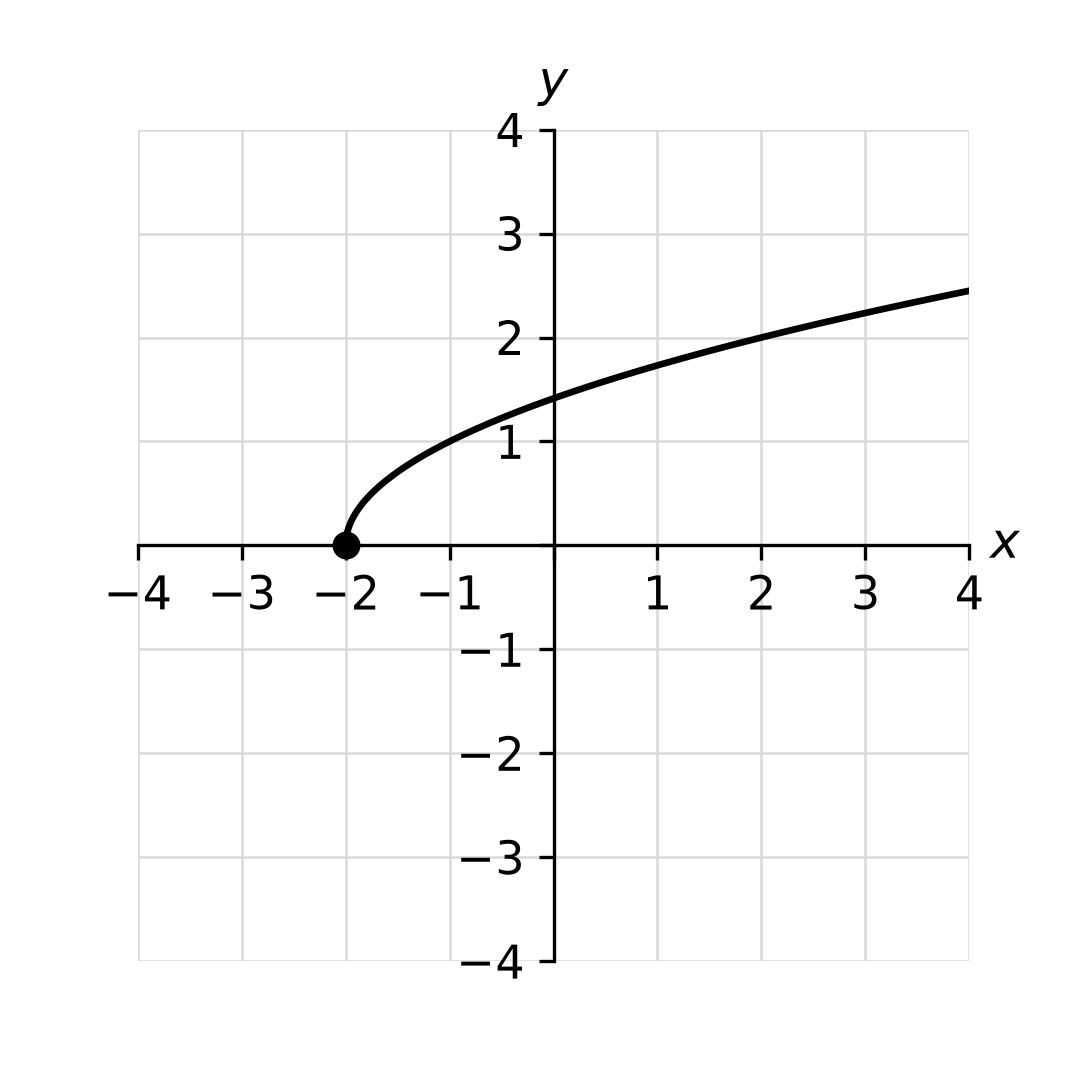
Which of the following graphs does NOT represent as a function of ?
What You’re Being Tested On:
Explore the learning objectives taken directly from the College Board’s AP® Precalculus Curriculum. Ensure you’re prepared for the exact topics covered on the AP® exam, in-class tests, and quizzes, and gain confidence in your mastery of the material.

Topic 1.1: Change in Tandem
Learning Objective: 1.1.A
Describe how the input and output values of a function vary together by comparing function values.
Essential Knowledge: 1.1.A.1
A function is a mathematical relation that maps a set of input values to a set of output values such that each input value is mapped to exactly one output value. The set of input values is called the domain of the function, and the set of output values is called the range of the function. The variable representing input values is called the independent variable, and the variable representing output values is called the dependent variable. Two functions, and , are equal if they have the same domain, and for every input value in that same domain, both functions yield the same output value ().
Essential Knowledge: 1.1.A.2
The input and output values of a function vary in tandem according to the function rule, which can be expressed graphically, numerically, analytically, or verbally. The image of an input value is the single output value yielded by the function rule. The preimage of an output value is the set of input values for which the function rule yields that output value.
Essential Knowledge: 1.1.A.3
A function is increasing over an interval of its domain if, as the input values increase, the output values always increase. That is, for all and in the interval, if , then .
Essential Knowledge: 1.1.A.4
A function is decreasing over an interval of its domain if, as the input values increase, the output values always decrease. That is, for all and in the interval, if , then . Exclusion: Discriminating between open intervals and closed intervals as it relates to intervals on which a function is increasing or intervals on which a function is decreasing is outside the scope of the AP Precalculus course and exam.
Learning Objective: 1.1.B
Construct a graph representing two quantities that vary with respect to each other in a contextual scenario.
Essential Knowledge: 1.1.B.1
The graph of a function displays a set of input-output pairs and shows how the values of the function’s input and output values vary.
Essential Knowledge: 1.1.B.2
A verbal description of the way aspects of phenomena change together can be the basis for constructing a graph.
Essential Knowledge: 1.1.B.3
The graph of a function is concave up on intervals in which the rate of change is increasing.
Essential Knowledge: 1.1.B.4
The graph of a function is concave down on intervals in which the rate of change is decreasing.
Essential Knowledge: 1.1.B.5
The graph intersects the -axis when the output value is zero. The corresponding input values are said to be zeros of the function.
