Topic 1.1 Notes – Change in Tandem
What a Function Is
A function matches each input to exactly one output. One input cannot split into two outputs.
- Domain means the allowed inputs.
- Range means the outputs you actually get.
- The independent variable is the input.
- The dependent variable is the output because it depends on the input.
If , that means the image of input 3 is 7. Here, 7 is the image of 3.
If you ask which inputs give output 7, you’re asking for the preimage of 7.
Function notation matters early in AP Precalculus.
means “the output when the input is .” It does not mean .
Two functions are equal only when both are true:
- they have the same domain
- they give the same output for every input in that domain
A function can appear in different forms, and the AP course expects you to move among all four:
- Analytical representation
a formula or rule, like - Numerical representation
a table of input-output pairs - Graphical representation
the set of points - Verbal representation
a description in words, like “square the input, then subtract 4”
On tests, domain is often where students lose easy points. In context, include it when it matters.
How Input and Output Vary Together
“In tandem” means the two quantities are linked by the function rule. It does not mean they both have to increase.
Increasing
A function is increasing on an interval if bigger inputs give bigger outputs.
That can happen even if all outputs are negative. Example: is still increasing.
Decreasing
A function is decreasing on an interval if bigger inputs give smaller outputs.
Constant portions
If the output stays the same for a stretch, that part is constant. Under the strict definition, it is neither increasing nor decreasing.
This graph shows all three behaviors in one place, so you can practice reading them left to right.
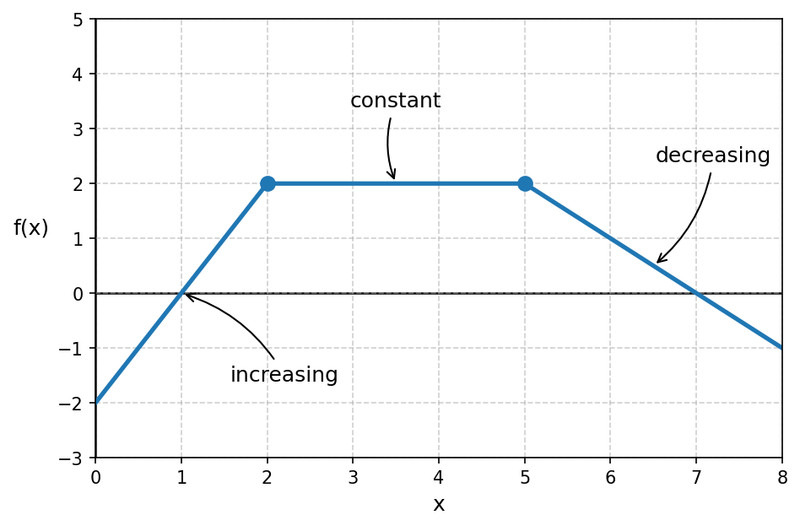
Increasing, constant, and decreasing intervals
You can read this from different representations:
- Graph: move left to right
- Table: compare only the listed values
- Words: “rises,” “falls,” “levels off”
Common mistake: a graph below the x-axis is not automatically decreasing. Negative outputs and decreasing behavior are different ideas.
Concavity and Rate of Change
Increasing/decreasing tells you the direction of change. Concavity tells you how the rate is changing.
- Concave up
rate of change is increasing, graph bends upward- rising faster and faster
- falling but slowing down
- Concave down
rate of change is decreasing, graph bends downward- rising but leveling off
- falling faster and faster
The four combinations all exist:
- increasing and concave up
- increasing and concave down
- decreasing and concave up
- decreasing and concave down
That third one is the one people doubt, but it’s completely possible. If outputs are dropping but not as steeply, the function is decreasing and concave up.
A straight-line segment has constant rate of change, so it is neither concave up nor concave down.
Zeros and What the Graph Shows
A zero is an input where the output is 0.
So zeros are the preimage of 0.
On the graph, zeros happen where the function meets the x-axis. Those points are x-intercepts.
The graph can:
- cross the x-axis
- touch and turn
- lie on the x-axis over an interval
These three cases are worth recognizing quickly because they all show zeros in different ways.
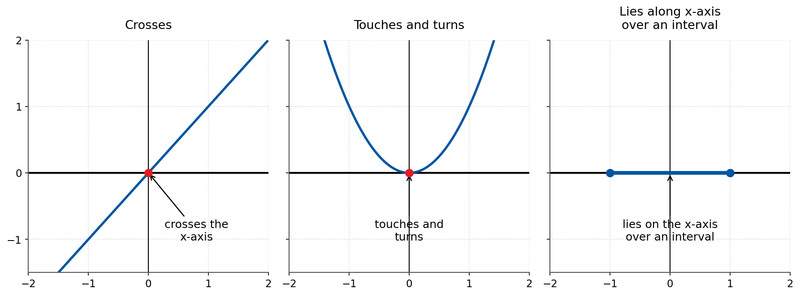
Do not mix up a zero with the y-intercept.
- zero means
- y-intercept means , if defined
Building a Graph from a Verbal Description
A verbal description gives features, not one exact curve.
- Identify the input and output.
- Label axes with units and use a sensible scale.
- Mark the contextual domain and key points.
- Decide where output is positive, negative, or zero.
- Sketch where it increases, decreases, or stays constant.
- Add concavity from rate language:
- rises faster and faster
- rises but levels off
- falls faster and faster
- falls but slows
- Decide whether the situation is continuous, discrete, or step-like.
A height-over-time graph is usually continuous. A graph of people entering a room every minute might be step-like or discrete.
Three exam traps show up a lot:
- one verbal description can fit many reasonable curves
- context can restrict the domain
- a table does not tell you exact behavior between listed inputs unless more is given
