Topic 3.14 Notes – Polar Function Graphs
What a Polar Function Graph Is
A polar function has the form . Here, tells you the direction and tells you the signed distance along that direction.
- The polar axis is the positive -axis.
- Positive angles go counterclockwise. Negative angles go clockwise.
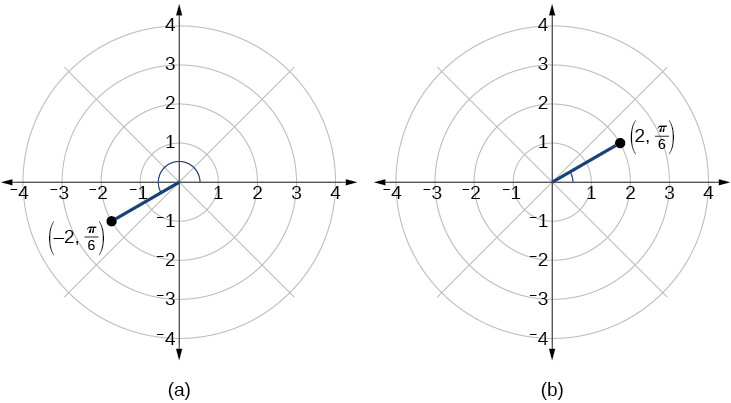
- If , plot on the terminal ray of .
- If , plot the point the other way, opposite that ray.
- If , the point is the origin.
The actual distance from the origin is , not .
The two panels below show that sign difference for the same angle . In panel (b), lies on the ray for . In panel (a), lands the same distance away in the opposite direction.
Equivalent polar points matter a lot:
So one physical point can have many polar names.
A quick check in rectangular coordinates is
but the main job here is graphing as polar, not converting.
One exam trap shows up constantly. The rectangular graph of is not the polar graph.
How to Construct the Graph
When you build a polar graph from a formula or table, the curve is traced as increases.
- Identify the domain of . Only graph that interval.
- Pick useful angles, usually unit-circle angles.
- Compute .
- Plot each polar point , handling negative correctly.
- Connect points in increasing order.
- Sketch smoothly if the function is continuous.
- Mark endpoints if the domain is restricted.
Angles worth prioritizing in a table:
- where so the graph hits the origin
- where changes sign
- where is largest or smallest
- where trig values are exact
- where the domain starts or ends
If you’re given a table, each row is an input-output pair , but the plotted point is the polar point , not the rectangular point .
Restricted Domains and Endpoints
A restricted domain means you keep only the part traced by those allowed -values.
The endpoints come from the polar pairs and , not just from the physical location. That matters because the same point can happen at different angles. The origin is the biggest source of confusion since works for any angle.
If an endpoint angle is included, that point is on the graph. If the endpoint angle is excluded, leave it off.
When a problem shows part of a curve and asks for the domain, you need both:
- the endpoint angles
- the path followed as increases
Patterns to Notice While Sketching
Some features tell you what kind of curve you’re getting.
- Origin crossings happen when .
- Sign changes in often flip the trace to the opposite side.
- Loops happen when the curve leaves a point, closes a piece, and returns.
- Self-intersections happen when different inputs give equivalent polar points.
Periodicity helps, but be careful.
- The period of can help find the full graph.
- The graph might close before one full period of angle values.
- Some curves retrace over .
- Some need longer intervals.
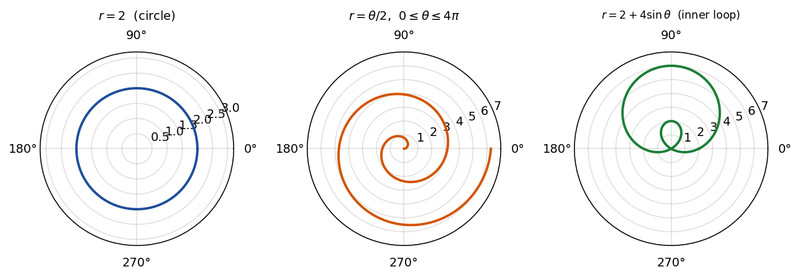
Examples you should recognize include a circle from a constant radius, a spiral from growing with , and a trig form that creates a looped shape.
- gives a circle centered at the origin.
- gives a spiral.
- Trig forms can create circles, indented curves, inner loops, and petal-like shapes.
Symmetry and Common Mistakes
Useful symmetry tests:
- gives symmetry about the polar axis
- gives symmetry about the vertical axis
- gives origin symmetry
- often means the graph retraces itself
Use symmetry to save work, but confirm it from the formula.
Common mistakes:
- treating like rectangular coordinates
- forgetting negative goes opposite the ray
- connecting nearest-looking points instead of increasing
- graphing the whole curve when the domain is restricted
- assuming is always enough
- confusing signed radius with distance
