Topic 4.14 Notes – Matrices Modeling Contexts
What a Two-State Transition Matrix Represents
A two-state transition model tracks a system where each item is in one of two states at each step, then some fraction switches each interval.
The diagram below shows that idea in a simple two-state system, with some amount staying in the same state and some moving to the other one.
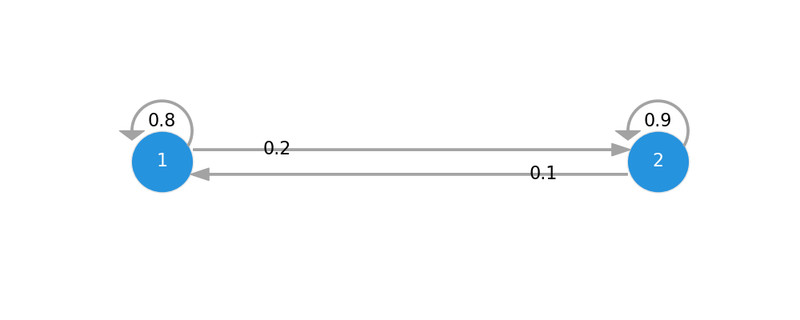
Two-state transition diagram
The state at step is written as a column vector
That means:
- is the amount in state after step
- is the amount in state after step
Those entries might be:
- counts like people or customers
- proportions of a whole
- probabilities of being in each state
If the model is closed, nothing enters or leaves the system, so the total stays constant. For counts, stays the same. For proportions or probabilities, the total stays .
One detail students mix up a lot: a rate like “20% move from to ” means 20% of the current amount in leaves . It does not mean the net amount in drops by 20%, because some amount may also enter from .
Also, keep the state order fixed everywhere. If your vector is , then every row and column must use first, second.
Building the Transition Matrix from a Context
If moves from to each step, and moves from to , then
Here’s how to read it:
- first column = what happens to the amount currently in
- second column = what happens to the amount currently in
- first row = what contributes to the next amount in
- second row = what contributes to the next amount in
The diagonal entries, and , are the retention rates.
Each source column should add to :
- from , either stay in or move to
- from , either move to or stay in
This setup shows up in contexts like:
- subscription plans switching between two options
- residents moving between two regions
- changing between two conditions such as healthy/sick or on/off
Common mistakes:
- putting both given rates in one row
- reversing “from” and “to”
- changing state order midway
- forgetting
Iterating a transition to later times
One step ahead uses
which means
So each new amount equals what stayed plus what came in.
For steps from the initial state,
That exponent means repeated matrix multiplication. , not squaring each entry.
Use:
- for the next step
- for steps from the start
Your output keeps the same units as the state vector. If the entries are counts, decimals are model predictions. Round at the end if the context needs whole people.
Quick checks:
- totals stay constant in a closed count model
- proportions or probabilities still sum to
Steady State
A steady state is a vector that satisfies
That means the distribution stays the same from step to step. People may still move both ways. The balance happens because the flows match:
If the total is , then
You’ll often find or confirm steady state by repeatedly multiplying with , or by using a large power , until the vectors stop changing much.
Do not assume every model settles to one steady state. Some alternate forever, and repeated rounding can throw off the long-term result.
Predicting Past States and Checking Validity
If is invertible, you can work backward:
For
the determinant is
So exists when .
This backward model reconstructs an earlier state. The entries of are not reverse transition probabilities, and they can be negative.
Be suspicious if you get:
- negative amounts in a context that should stay nonnegative
- a backward calculation with a noninvertible matrix
- weird results caused by a rounded current state
On tests, keep the interval length, state labels, and state order attached to your answer.
