Topic 4.5 Notes – Implicitly Defined Functions
When an equation defines y without solving for it
An equation in two variables describes a relation. That means it gives all ordered pairs that make the equation true.
- Implicit form looks like , such as .
- Explicit form isolates one variable, like or .
One implicit equation can behave in different ways:
- it might describe one function of , like a line
- it might describe more than one branch, like a circle
- it might work better as as a function of
The whole relation is a function of only if every -value matches with at most one -value. That is the vertical line test.
The whole relation is a function of only if every -value matches with at most one -value. That is the horizontal line test.
A common trap is solving for one variable and forgetting that you may have shown only part of the graph.
Graphing an Equation in Two Variables
The graph is just the set of all solutions. So graphing means finding points that satisfy the equation and plotting them.
A useful graphing routine
- Pick values for one variable and solve for the other.
- Check candidate points by plugging them into the original equation.
- Solve for or if that makes the shape easier to see.
- Use intercepts, symmetry, and restrictions from square roots or denominators.
- Connect points in a way that matches the algebraic shape.
For , this routine gives a few easy points and helps you recognize the overall shape.
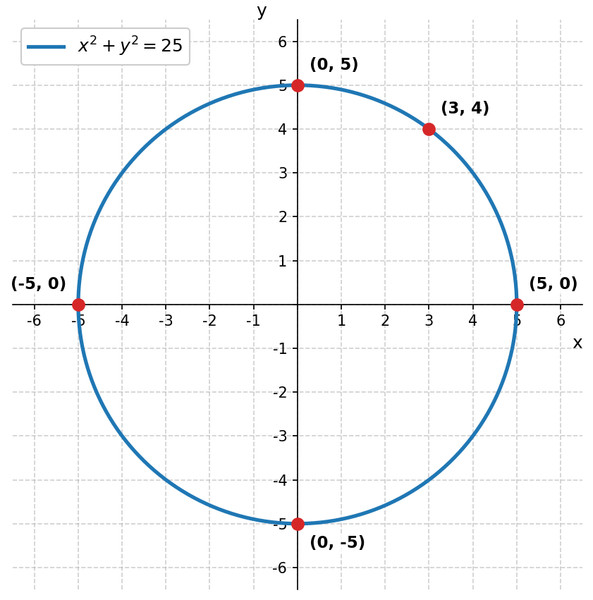
- , , , are on the graph.
- Check by substitution
, so it works. - Check
, so it is not on the graph.
That graph is a circle, so you should connect points as a circle, not just draw line segments through a table.
Solving for Branches and Keeping Restrictions Straight
For , solving for gives
This is two branches:
- gives the upper semicircle
- gives the lower semicircle
The full circle is not one function of , but each branch is.
Solving for gives
Now you get the right and left semicircles, each a function of .
Keep the restrictions:
- for the square root to exist
- denominators can never be zero
- means the principal square root, so it gives only the nonnegative branch unless you add the negative one separately
Compare these three:
- gives multiple branches
- is not one function of , but it is one function of
- becomes , which is the whole graph
How and Vary Together
For nearby points on the graph, look at the change ratios
Their sign tells how the variables move together.
- Positive ratio means they move in the same direction.
- as one increases, the other increases
- going the other way, both decrease
- Negative ratio means they move in opposite directions.
This is always local. One part of a graph can have a positive ratio and another part a negative ratio.
On :
- upper-right part has negative
- lower-right part has positive
If both ratios are defined, they have the same sign, because is the reciprocal of . Reciprocals of a nonzero number are always the same sign.
Horizontal and Vertical Behavior and Common Traps
If , then stayed the same while changed. That is horizontal behavior.
If , then stayed the same while changed. That is vertical behavior.
On the circle:
- top and bottom have horizontal direction
- left and right sides have vertical direction
Common mistakes:
- treating every implicit equation as one function of
- losing a branch after taking a square root
- mixing up relation-wide coordinate restrictions with branch domain/range
- assuming local covariation stays true everywhere
- switching horizontal and vertical meanings of zero rate of change
