Topic 3.5 Notes – Sinusoidal Functions
What Sinusoidal Functions Are
A sinusoidal function is a smooth oscillating function you get from the sine graph by shifting, stretching, compressing, or reflecting it. It keeps repeating the same wave pattern.
The two parent sinusoidal functions are sine and cosine. They have the same basic shape, just lined up differently on the horizontal axis.
That means cosine is just a horizontally shifted version of sine.
Parent functions
On the graph, you can see that shift directly by comparing the two parent functions over one cycle.
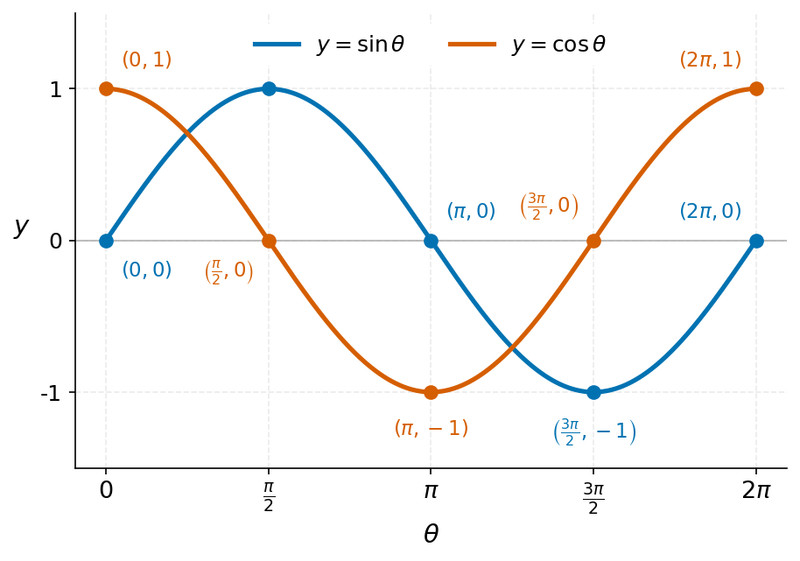
Sine and cosine parent functions
For , one cycle goes through these key points:
For , one cycle goes through:
Both have:
- Domain all real numbers
- Range
The Key Characteristics of a Sinusoidal Graph
These all fit together, so read them as one package.
Here is the maximum and is the minimum.
- Maximum and minimum are the highest and lowest outputs. They tell you how tall the wave is overall.
- Midline is the horizontal line halfway between max and min. For sine and cosine, it is .
- Amplitude is the vertical distance from the midline to a peak or trough. It is always nonnegative. For sine and cosine, amplitude .
- Period is the smallest positive input change that makes the graph repeat, so . For sine and cosine, period .
- Frequency is cycles per unit of input. For sine and cosine, frequency .
- Range comes from the midline and amplitude: , where the midline is .
A common trap is mixing up frequency with a coefficient inside a trig expression. In this topic, frequency means the reciprocal of period.
How to Read These Characteristics from a Graph
When a graph is given, pull the features out in this order:
- Find the maximum and minimum values.
- Compute
- amplitude
- midline value
- Find the period by measuring between matching points in consecutive cycles:
- max to next max
- min to next min
- midline crossing to next midline crossing in the same direction
- Take the reciprocal to get frequency.
- Write the range from minimum to maximum.
Example. If max , min , and consecutive maxima happen 6 units apart, then:
- amplitude
- midline
- period
- frequency
- range
“Same output” does not automatically mean one full period. Two consecutive midline crossings are often only half a period apart.
How Sinusoidal Graphs Behave
A sinusoidal graph keeps crossing its midline and switching concavity.
- Concave down happens around arches and maxima
- Concave up happens around troughs and minima
- For standard sine and cosine, the concavity changes at midline crossings
The graph below highlights those curved regions on one cycle of sine and cosine.
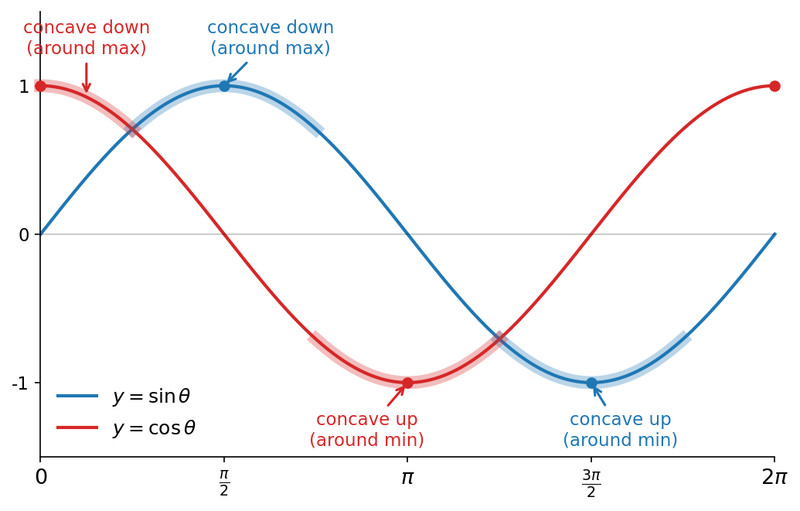
For over one cycle:
- concave down on
- concave up on
For over one cycle:
- concave down on
- concave up on
Whatever concavity pattern you see in one cycle repeats every cycle.
Symmetry and Common Mistakes
Sine symmetry
Sine has rotational symmetry about the origin:
So sine is an odd function.
Cosine symmetry
Cosine has reflection symmetry across the -axis:
So cosine is an even function.
Common mistakes
- Writing amplitude as negative after a reflection. Amplitude is a distance, so it stays nonnegative.
- Confusing the midline value with the midline equation .
- Using two consecutive midline crossings as a full period.
- Assuming a shifted sinusoidal graph is still odd or even about the origin or -axis.
- Forgetting the different starting points. Sine starts on the midline, cosine starts at a maximum.
