Topic 3.7 Notes – Sinusoidal Function Context and Data Modeling
What a Sinusoidal Model Is
A sinusoidal model describes a smooth repeating pattern with sine or cosine:
These parameters tell you the whole story:
- Amplitude
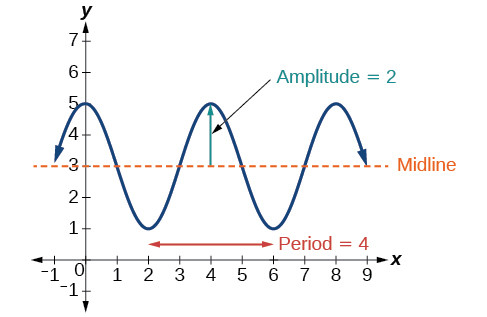
This is half the distance from the max to the min. - Midline
This is the center value the graph oscillates around. - Period
This is one full cycle. - Frequency
This is cycles per input unit. - Phase shift in this form
This tells you where the cycle sits horizontally.
On a graph, the key features are the amplitude, midline, and period.
If the maximum is and the minimum is , then
Also,
A sinusoidal model works well when the pattern is:
- smooth and wave-like
- repeating with about the same max, min, midline, and period
Good examples you should recognize:
- height on a rotating wheel
- tidal height
- seasonal temperature
- hours of daylight
It does not fit well if the repeating pattern is step-like, jagged, uneven, or if the amplitude, period, or midline changes a lot.
Building the Model from Context, a Graph, or a Table
You need five features: max/min, amplitude/midline, period/, a phase-shift anchor, and the contextual domain with units.
- From maximum and minimum
- amplitude
- midline
- common mistake: amplitude is not the maximum unless the midline is 0
- From repeating -values
- period comes from consecutive maxima or consecutive minima
- max to next min is only half a period
- Choosing sine or cosine
- cosine is handy if you know a max or min
- sine is handy if you know a midline crossing and whether the graph is going up or down
- both can model the same data
Finding the phase shift
Use a point you can recognize on the parent graph:
- maximum
- minimum
- increasing midline crossing
- decreasing midline crossing
Be careful with form:
- In , phase shift is
- In , phase shift is
- In , phase shift is
If a table is imperfect, the exact peak might not appear. Then estimate from nearby values and the overall wave shape.
Sinusoidal Regression and Reading the Output
Regression is for real data that does not land exactly on one sinusoid.
A typical workflow looks like this:
- Enter paired data.
- Make a scatterplot.
- Check that it looks sinusoidal.
- Estimate amplitude, midline, and period if needed.
- Run sinusoidal regression.
- Compare the curve to the data.
From the output:
- amplitude comes from the vertical coefficient
- midline comes from the vertical shift
- period comes from
- phase shift depends on the form shown by the calculator
Data sets that often look sinusoidal:
- rotating wheel height
- lake or seasonal temperature
- tidal height
- hours of daylight
Keep coefficients unrounded until the end. If the model is estimated, your answers should usually be approximate too.
Using the Model in Context
To predict an output, plug in the input and keep the units in your conclusion.
To find inputs from an output, solve the trig equation or use graph intersections/technology.
A few patterns show up a lot:
- values strictly between max and min usually happen twice per cycle
- a maximum or minimum usually happens once per cycle
- keep only solutions that fit the contextual domain
That domain matters. A sinusoidal equation repeats forever, but the model may only make sense on a limited interval. Interpolation within the data interval is more reliable than extrapolation beyond it.
Common Mistakes to Catch Fast
- Amplitude is , not the maximum value.
- Midline is , not .
- is not the period. Use .
- Max to next min is half a period.
- Phase shift signs change with equation form.
- Different sine and cosine equations can represent the same model.
- Units matter:
- amplitude and midline use output units
- period and phase shift use input units
- frequency uses cycles per input unit
- A model can be algebraically good but contextually useless outside its domain.
- If you use -based formulas, your calculator work must match radian mode.
