Topic 1.2 Notes – Rates of Change
What Rates of Change Mean
A rate of change compares how much the output changes to how much the input changes.
For a function , the average rate of change from to is
This is the constant rate that would give the same total output change across that interval.
- If the rate is positive, input and output move in the same direction.
- If the rate is negative, they move in opposite directions.
- If the average rate is zero, then . The function could still rise and fall in between.
Graphically, average rate of change is the slope of the secant line through and . The graph below shows that secant line connecting the two points on the curve.
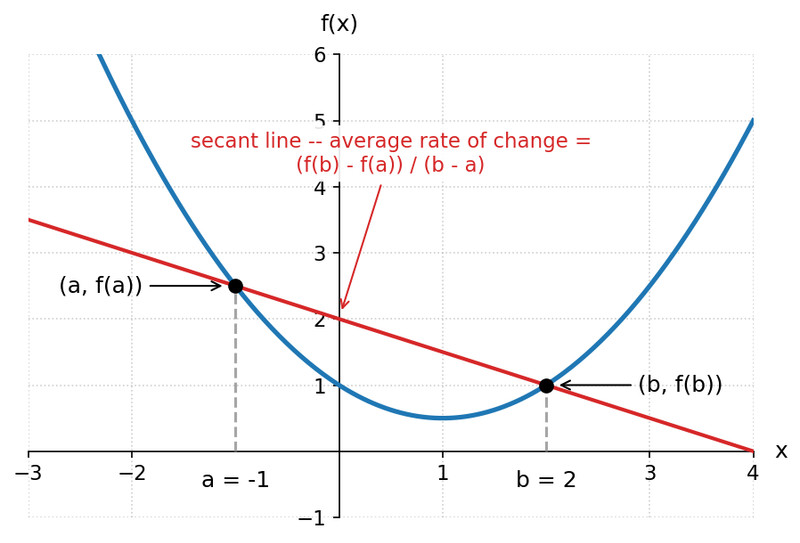
Secant line and average rate of change
Units matter. If is distance in meters and is time in seconds, the rate is in meters per second.
A rate of change at a point is more local. You can’t plug the same point into the average-rate formula because . So you estimate it using very small nearby intervals.
Finding Average Rate of Change from Any Representation
No matter how the function is given, the idea stays the same: change in output divided by change in input.
- From an equation
- Find and first.
- Then compute .
- Example: on
- From a table
- Use the rows for the two input values only.
- Keep subtraction order consistent in numerator and denominator.
- From a graph
- Read the two endpoint coordinates.
- Compute the slope of the secant line.
- Graph answers are often estimates.
- From a verbal context
- Identify the starting and ending values of both quantities.
- Divide output change by input change and include units.
Common mistakes show up a lot on quizzes:
- It is not the average of and .
- Values between endpoints do not affect the calculation.
- Reversing only the numerator or only the denominator flips the sign.
Approximating Rate of Change at a Point
To estimate the rate at , use nearby average rates.
- Pick inputs very close to .
- Compute average rates to the left and right when possible.
- A centered interval can help.
- Compare the nearby values and estimate the local rate.
Example with at :
- Left side
- Right side
So the local rate at is about .
On a graph, the local rate is the slope of the tangent line near the point:
- large positive means rising steeply
- small positive means rising gently
- negative means falling
- near zero means locally flat
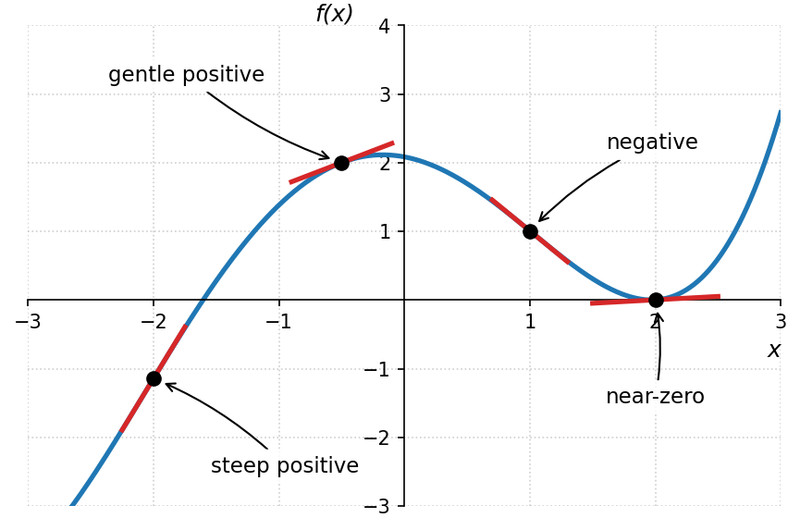
Local rates on a graph
Smaller intervals are more local, but if graph or table values are rounded too much, tiny intervals can give unreliable estimates.
Which input is changing faster
To compare rates at two points, approximate each one with small intervals near that point. Don’t use one big interval covering both points.
If one point has rate and another has rate :
- As signed rates,
- As speed of change, , so the output is changing faster at the second point
When you describe the result:
- positive rate means as input increases, output increases
- negative rate means as input increases, output decreases
Always justify with the intervals and calculations you used.
When Rate Conclusions Can Go Wrong
A lot of wrong answers come from over-reading what a rate tells you.
- A positive average rate does not mean the function increased the whole time.
- A zero average rate does not mean the function stayed constant.
- A point rate may fail to exist.
The standard example is at . In the graph, the slopes coming in from the left and right are different.
- Left-side rate is about
- Right-side rate is about
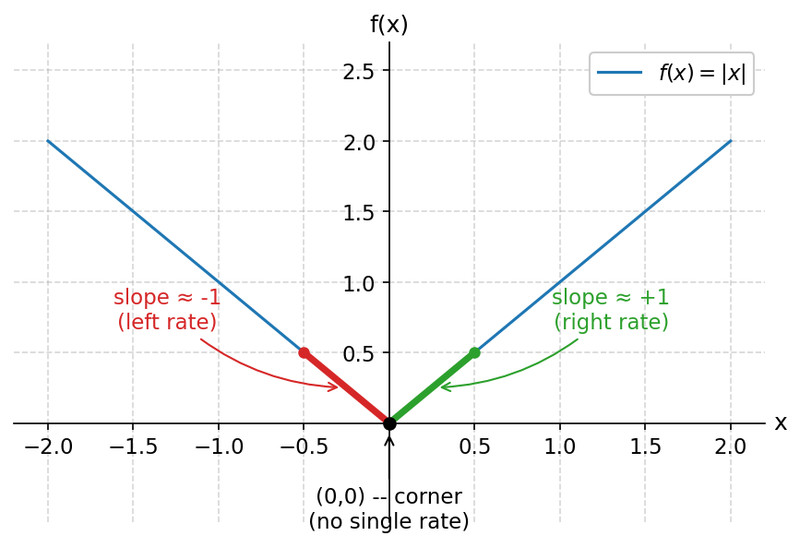
Those do not agree, so there is no single rate at that point. The graph has a sharp corner.
A centered interval can mislead here, so check both sides when both are in the domain. At a domain endpoint, only use intervals that stay inside the domain.
