Topic 3.15 Notes – Rates of Change in Polar Functions
Signed Radius and Distance from the Origin
In polar coordinates, a point is written as . Here, tells you the direction, and tells you how far to go from the origin.
The catch is that distance from the origin is , not .
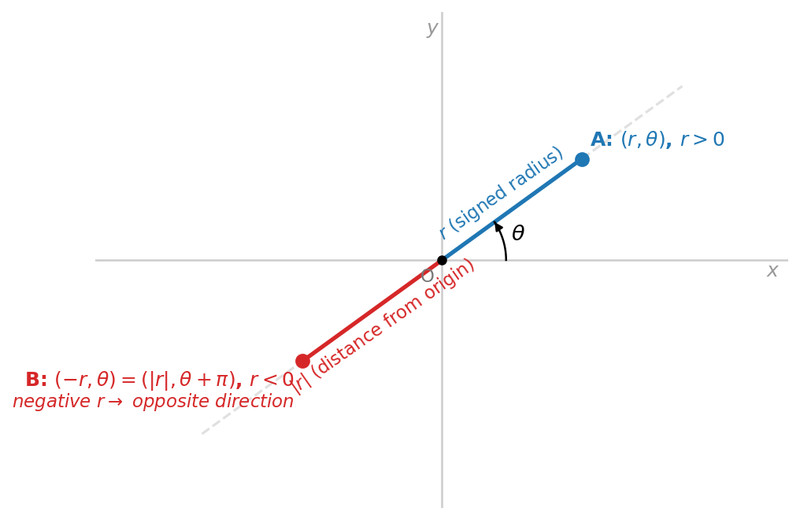
- If , the point is on the terminal side of angle , units from the origin.
- If , the point is units from the origin in the opposite direction.
- If , the point is at the origin.
This diagram shows the same angle paired with a positive radius and a negative radius.
As increases, use this rule set:
- positive and increasing farther from the origin
- positive and decreasing closer to the origin
- negative and increasing closer to the origin
- negative and decreasing farther from the origin
That is one of the most tested ideas here. “Increasing ” is about the signed radius. “Closer/farther” is about . Those are not always the same thing.
Reading Radial Behavior from a Formula, Table, or Graph
No matter how the information is given, you are always checking the same two things together:
- Is positive or negative?
- Is increasing or decreasing?
A graph of versus is usually the easiest, because you can read sign from whether the graph is above or below the axis, and direction of change from whether it rises or falls.
For on , the graph makes the sign change at especially easy to see:
- On , is positive and decreasing the point moves closer.
- At , the point is at the origin.
- On , is negative and decreasing the point moves farther.
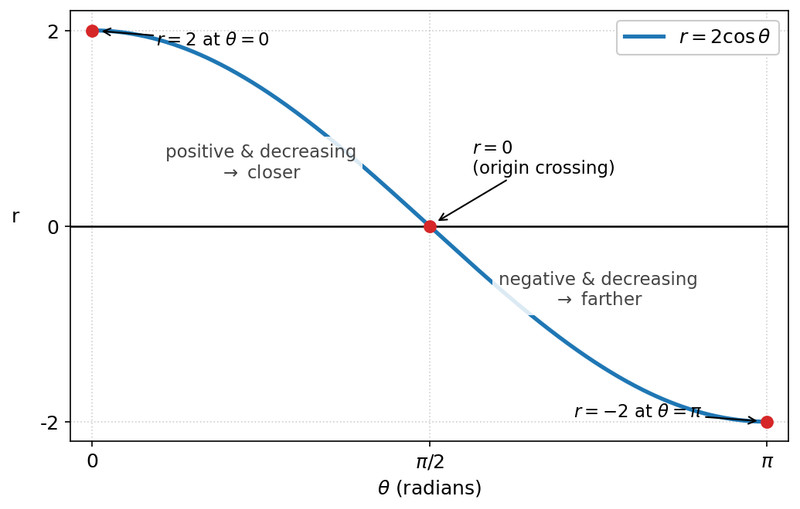
Graph of on
A common trap is thinking “decreasing” always means moving toward the origin. This graph shows why that is not true. It only does that when is positive. Also, “closer/farther from the origin” is about radial distance, not distance traveled along the curve.
Closest and Farthest Points from Relative Extrema
When changes from increasing to decreasing, it has a relative maximum. When it changes from decreasing to increasing, it has a relative minimum.
These can give closest or farthest points from the origin, but the sign matters.
- If
- relative maximum of relatively farthest
- relative minimum of relatively closest
- If
- relative maximum of relatively closest
- relative minimum of relatively farthest
Compare these:
- stays positive, so its relative max gives a farthest point and its relative min gives a closest point.
- stays negative, so that flips.
If , the point is at the origin, so it is a closest point even if does not turn there. On a restricted interval, also check endpoints for absolute closest/farthest. And don’t confuse this with highest or leftmost on the graph.
Average Rate of Change of with Respect to
The average rate of change of signed radius is
This tells you the average change in signed radius per unit of angle. Usually the units are radial units per radian.
On the graph of versus , this is the slope of the secant line. It is not the slope between two points on the polar curve in the -plane.
Example for on :
So the signed radius decreases on average by units per radian.
- positive average rate net increase in signed radius
- negative average rate net decrease
- zero average rate same endpoint signed radius
Estimating Radius Values with Average Rate
You can use the secant line to estimate radius values inside an interval.
- Find the average rate
- Use
For on , . Estimate :
That estimate is a signed radius. If your estimate is negative, the distance from the origin is its absolute value.
This works best on short intervals or where the -versus- graph is nearly linear. This topic stops at average rate of change. Derivatives, tangent slopes to polar curves, and speed are outside AP scope here.
