Topic 4.1 Notes – Parametric Functions
What a Parametric Function Is
A parametric function in the plane has the form
This means one input, , produces one output point in , which just means an ordered pair .
You’ll also see the same idea written as the pair of equations
Those are equivalent. They are just two ways to show that both coordinates come from the same parameter .
You can think of the parameter as feeding into a rule that outputs a point in the plane.
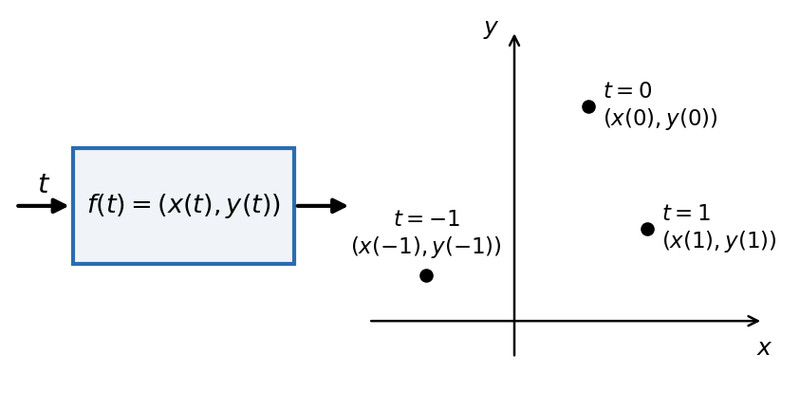
Parametric function as point-valued output
A few details matter a lot:
- is the parameter. It is the shared independent variable for both coordinates.
- At a specific value , the point is
- The graph is drawn in the -plane. You do not put on an axis.
- Unlike , neither coordinate is the input to the other. Both depend on .
- Each allowed -value must give exactly one point.
- Different -values can give the same point. That still counts as a function of .
From Equations to a Table and Graph
This process is what you’ll do on quizzes most often.
- Write the full analytical form, meaning , , and the domain of .
- Pick values of from that domain.
- Evaluate both and at the same -value.
- Record rows as .
- Keep the rows in increasing -order.
- Plot the ordered pairs in the -plane.
- Connect them in increasing -order.
- Add arrows to show direction.
If the coordinate functions are smooth, your sketch should be smooth too. A table gives sample points from a curve, not usually a broken line graph.
How the Domain Controls the Graph
The domain of tells you which part of the curve actually appears.
- If , the graph starts at and ends at . Both endpoints are included.
- If an endpoint is excluded, the graph may show an open endpoint there, if that point is only approached and never actually produced.
- If the domain is unbounded, the curve may have no start point, no end point, or neither.
- Restricting the domain can shorten the curve, isolate one piece, or stop retracing.
So the formulas may describe a larger geometric curve, but the allowed -values decide how much you draw.
Reading Across Representations
You need to move easily among the three forms:
- Analytical: formulas , , plus domain
- Numerical: table of -values and points
- Graphical: plotted curve traced in parameter order
- Verbal: where it starts, where it ends, and how it moves as increases
Example
Sample table:
| point | |||
|---|---|---|---|
| 3 | -2 | ||
| 0 | -1 | ||
| 0 | -1 | 0 | |
| 1 | 0 | 1 | |
| 2 | 3 | 2 |
Plotting those points and following them in increasing gives a right-opening parabolic arc. As increases, it goes from lower right to the leftmost point, then to upper right.
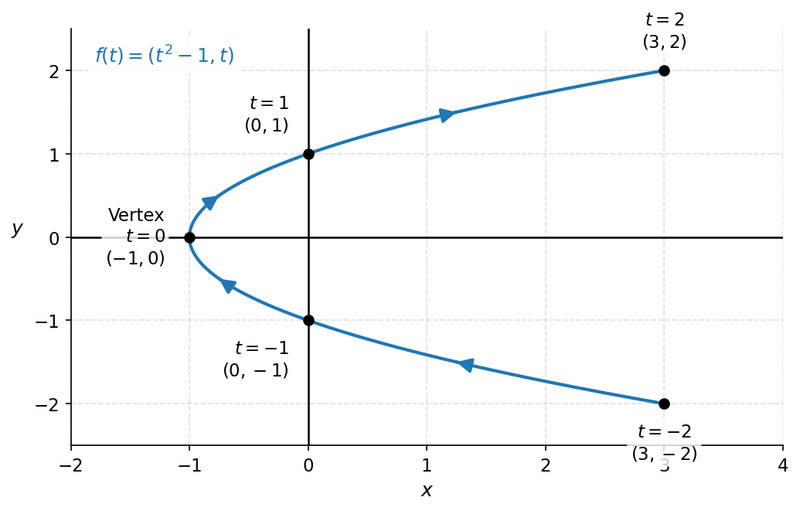
It fails the vertical line test as versus , but it is still a valid parametric function because each gives one point.
Common Mistakes on the Exam
- Pairing with . Each row must use the same parameter value.
- Connecting points by increasing instead of increasing .
- Forgetting arrows, endpoints, or open versus closed endpoint behavior.
- Ignoring a restricted domain and drawing too much of the curve.
- Using too few points and missing a turn or bend.
- Treating like one graph axis instead of graphing .
