5m left·0%
Reading Time: 5 min
Last Updated: August 19, 2026
Main Ideas: 5
Reading Time: 5 min
Last Updated: August 19, 2026
Main Ideas: 5

Topic 3.6 Notes – Sinusoidal Function Transformations

Verified for 2027 AP® Precalculus Exam
Read aloud
Sinusoidal transformations tell you how a sine or cosine graph changes when you stretch it, shift it, or reflect it. In this topic, you read those changes from an equation, sketch a cycle from the parameters, and go the other way by building an equation from a graph.

What Sinusoidal Transformations Are

A transformed sinusoidal function has one of these forms:

f(θ)=asin⁡(b(θ+c))+dg(θ)=acos⁡(b(θ+c))+d f(\theta)=a\sin(b(\theta+c))+d \qquad g(\theta)=a\cos(b(\theta+c))+d

Your parent reminder is simple. For both y=sin⁡θy=\sin\theta and y=cos⁡θy=\cos\theta:

  • amplitude =1=1
  • period =2π=2\pi
  • midline y=0y=0

The four parameters work together:

  • aa changes vertical stretch or compression, and if it’s negative, the graph reflects
  • bb changes horizontal stretch or compression, so it changes the period
  • cc gives the phase shift, which is the horizontal shift
  • dd gives the vertical shift, so the midline becomes y=dy=d

In the graph, each colored curve changes just one feature of y=sin⁡θy=\sin\theta. That makes it easier to connect the equation to what happens visually.
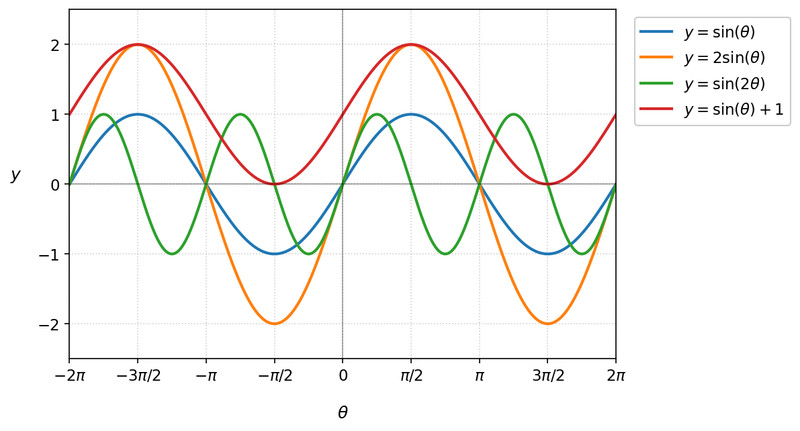
Basic transformations of y=sin⁡θy=\sin\theta

Sine and cosine follow the same transformation rules because cosine is just a shifted sine curve. Also, formulas here use radians, not degrees.

Reading the Parameters from an Equation

For asin⁡(b(θ+c))+da\sin(b(\theta+c))+d or acos⁡(b(θ+c))+da\cos(b(\theta+c))+d:

amplitude=∣a∣,period=2π∣b∣,phase shift=−c,midline y=d \text{amplitude}=|a|,\quad \text{period}=\frac{2\pi}{|b|},\quad \text{phase shift}=-c,\quad \text{midline } y=d

And from that you also get:

  • maximum =d+∣a∣=d+|a|
  • minimum =d−∣a∣=d-|a|
  • range =[d−∣a∣, d+∣a∣]=[d-|a|,\ d+|a|]
  • domain is all real numbers

Reflections and sign effects

A few signs trip people up a lot:

  • If a<0a<0, the graph is reflected relative to its midline shape. The amplitude is still positive.
  • If b<0b<0, the period still uses ∣b∣|b|.
  • A negative bb can often be rewritten away, so for period, your eye should go to ∣b∣|b|.

Factoring before finding phase shift

If the inside is written as Bθ+CB\theta+C, don’t grab CC as the shift.

Bθ+C=B(θ+CB) B\theta+C=B\left(\theta+\frac{C}{B}\right)

So the phase shift is −CB-\frac{C}{B}, not −C-C.

Example:

−2cos⁡(4θ+π)+1=−2cos⁡(4(θ+π4))+1 -2\cos(4\theta+\pi)+1 = -2\cos\left(4\left(\theta+\frac{\pi}{4}\right)\right)+1

Now you can read it correctly:

  • amplitude =2=2
  • period =2π4=π2=\frac{2\pi}{4}=\frac{\pi}{2}
  • phase shift =−π4=-\frac{\pi}{4} or right π4\frac{\pi}{4}
  • vertical shift =1=1
  • midline y=1y=1

Sketching One Cycle from the Equation

One cycle is easiest with five key points.

For example, the graph of y=2sin⁡(θ−π4)+1y=2\sin(\theta-\frac{\pi}{4})+1 starts at the phase shift, then hits the next four key points by moving one quarter-period at a time.
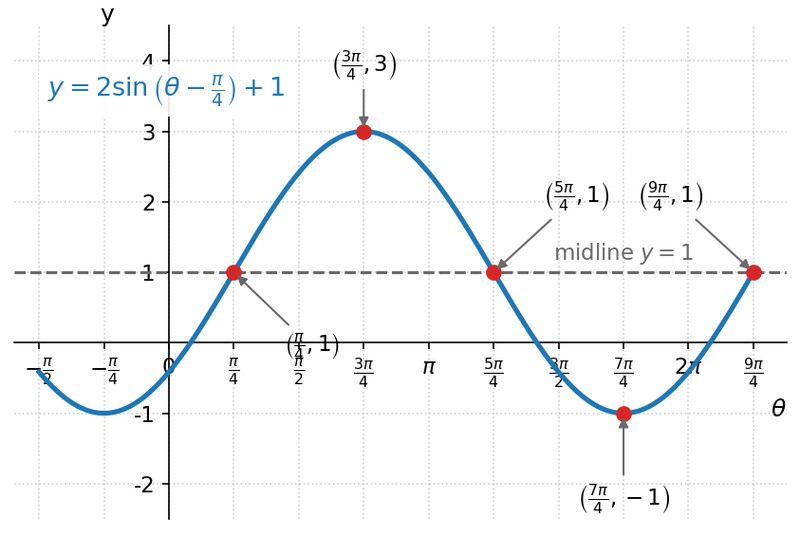
Rewrite in the clearer form asin⁡(b(θ−h))+da\sin(b(\theta-h))+d or acos⁡(b(θ−h))+da\cos(b(\theta-h))+d, where hh is the phase shift. Then find:

  • midline y=dy=d
  • amplitude ∣a∣|a|
  • period P=2π∣b∣P=\frac{2\pi}{|b|}
  • quarter-period P4\frac{P}{4}

Place the first point at θ=h\theta=h, then move by quarter-periods.

Sine pattern

  • at hh, value dd
  • at h+P4h+\frac{P}{4}, value d+ad+a
  • at h+P2h+\frac{P}{2}, value dd
  • at h+3P4h+\frac{3P}{4}, value d−ad-a
  • at h+Ph+P, value dd

Positive sine rises first. Negative sine falls first.

Cosine pattern

  • at hh, value d+ad+a
  • at h+P4h+\frac{P}{4}, value dd
  • at h+P2h+\frac{P}{2}, value d−ad-a
  • at h+3P4h+\frac{3P}{4}, value dd
  • at h+Ph+P, value d+ad+a

Positive cosine starts at a maximum. Negative cosine starts at a minimum.

Writing a sinusoid from a sketched graph

Work from the graph’s visible features.

amplitude=M−m2d=M+m2b=2πP \text{amplitude}=\frac{M-m}{2} \qquad d=\frac{M+m}{2} \qquad b=\frac{2\pi}{P}

where MM is the maximum, mm is the minimum, and PP is the period.

Then choose a form that matches an easy feature:

  • maximum →\rightarrow positive cosine
  • minimum →\rightarrow negative cosine
  • increasing midline crossing →\rightarrow positive sine
  • decreasing midline crossing →\rightarrow negative sine

Example with maximum 88, minimum 22, period 3π3\pi, and maximum at −π4-\frac{\pi}{4}:

  • amplitude =8−22=3=\frac{8-2}{2}=3
  • midline d=8+22=5d=\frac{8+2}{2}=5
  • b=2π3π=23b=\frac{2\pi}{3\pi}=\frac{2}{3}

A good equation is

y=3cos⁡(23(θ+π4))+5 y=3\cos\left(\frac{2}{3}\left(\theta+\frac{\pi}{4}\right)\right)+5

Common Mistakes and Exam Traps

  • Amplitude is ∣a∣|a|, so it is never negative.
  • Period is 2π∣b∣\frac{2\pi}{|b|}, not 2πb\frac{2\pi}{b} if b<0b<0.
  • In 4θ+π4\theta+\pi, the phase shift is not just −π-\pi. Factor first.
  • Inside and outside shifts go different directions. +d+d shifts up, but +c+c inside shifts left.
  • The midline y=dy=d is the center of the wave, not the max or min.
  • A graph can have more than one correct equation. Equivalent sine and cosine forms are common on FRQs and MCQs.

Key Takeaways

In asin⁡(b(θ+c))+da\sin(b(\theta+c))+d or acos⁡(b(θ+c))+da\cos(b(\theta+c))+d, amplitude is ∣a∣|a|, period is 2π∣b∣\frac{2\pi}{|b|}, phase shift is −c-c, and midline is y=dy=d.
A negative aa reflects the graph’s orientation, but the amplitude stays positive.
If the input is unfactored, like Bθ+CB\theta+C, the phase shift is −CB-\frac{C}{B}, not −C-C.
The five key points over one period are often the fastest way to sketch a sinusoid by hand.
Positive cosine starts at a maximum and positive sine starts at the midline going up.
Two different-looking equations can represent the same sinusoidal graph.

AP® is a trademark registered by the College Board, which is not affiliated with, and does not endorse this website.

Notes

1 credit used · 5/5 remaining