Topic 3.1 Notes – Periodic Phenomena
What a Periodic Function Is
A periodic function repeats its outputs in the same order again and again. The input usually keeps increasing, but after a fixed horizontal shift, the function comes back to the same behavior.
The exact definition of period is
for all applicable , where is the smallest positive number that makes this true.
A few ideas are packed into that definition:
- One cycle is one complete copy of the repeating pattern.
- A cycle can begin at different places on the graph. You just need the full pattern exactly once.
- If the period is , then every point repeats horizontally: for any integer .
- One cycle determines the whole function, because every other cycle is just a horizontal shift by a multiple of the period.
- The range, shape, maxima, minima, and intervals where the function rises, falls, or stays flat all repeat from cycle to cycle.
Recognizing Periodicity and Finding the Period
Sometimes periodicity comes from the context itself. If the same conditions repeat, the output may repeat too, like the height of a point on a Ferris wheel turning at a constant rate.
You can also spot periodicity from outputs:
- The outputs must repeat in the same order
- The repeats must happen over equal-length input intervals
- You match blocks of behavior, not one lucky repeated value
For example, if a pattern repeats every 8 units, then 16 and 24 also work, but the period is still 8 because it must be the smallest positive repeat length.
Good ways to estimate period:
- Match one maximum to the next matching maximum
- Match one full output block to the next full block
- Use context clues about how long one full repetition takes
What is not enough:
- Same output at two inputs. For example, does not prove period 5.
- A graph that rises and falls or looks wavy
- A repeating event schedule when the measured output itself does not repeat
Also, periodic does not mean sinusoidal. A function can be periodic and look like:
- a step function
- a triangular wave
- any other repeating shape
Graphing from One Cycle
Once you know one cycle, you can build the entire graph.
- Identify the input and output, including units.
- Find the cycle length.
- Mark important values and when they happen in one full cycle.
- Sketch the shape within that cycle.
- increasing, decreasing, or constant
- faster or slower change
- maxima and minima
- corners, jumps, or smooth connections
- concavity if described
- Repeat that exact shape left and right by one period at a time.
Be careful with endpoints. If one cycle ends where the next begins, that location belongs to both visually, but you don’t want to double-count it when describing one cycle.
Automated observation platform
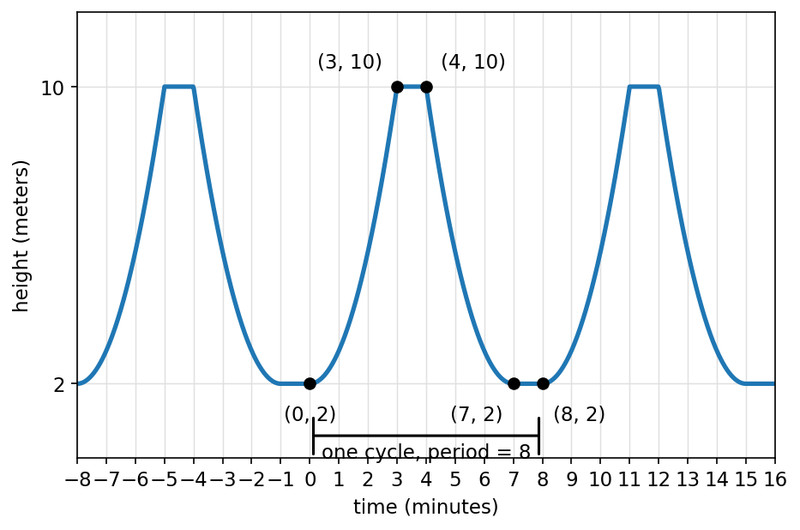
Here’s the full example you could easily see on a quiz. Notice that the graph highlights one cycle from to , then repeats the same shape to the left and right.
- starts at meters
- rises to meters over the first 3 minutes, slowly at first then faster
- stays at meters for 1 minute
- descends to meters over the next 3 minutes, slowing near the bottom
- stays at meters for the final minute
- repeats every 8 minutes
Characteristics That Repeat
Everything you see in one period comes back in every period.
- If the function increases on , then it also increases on
- The same is true for decreasing and constant intervals
- Local maxima and minima repeat one period apart
- Concavity repeats in corresponding parts of each cycle
- Rates of change repeat too, so the same steepness pattern shows up again
That compact interval notation shows up a lot in AP-style answers.
Common Mistakes
- Calling a function periodic because one -value repeats
- Forgetting that the period must be the smallest positive repeat length
- Copying only key points from one cycle and not the shape between them
- Thinking periodic graphs must be smooth
- Treating real-world cycles as exact when they may only be approximate
- Mixing up a repeating schedule with a repeating output pattern
