Topic 4.2 Notes – Introduction to Using Data Sets
1. What a Data Set Is
A data set is a collection of related pieces of information.
“Related” means each value represents the same type of thing:
- Test scores from one class
- Daily step counts for a month
- Monthly sales numbers
- Attendance records (present/absent)
Each value follows the same structure:
- All numbers (like temperatures)
- All words (like product names)
- All boolean values (true/false)
The shift in thinking is this:
- We don’t care about one value by itself.
- We care about what the entire collection tells us.
Instead of writing separate variables like score1, score2, score3, you think:
“How do I process every score the same way?”
That idea of scalability matters a lot. A good algorithm works whether there are 5 values or 5 million. You design a pattern, not one-off code.
2. Sequential Processing One Value at a Time
When analyzing a data set, you usually access values one at a time.
You:
- Look at one value
- Update some tracking information
- Move to the next value
- Repeat
That pattern is the backbone of almost every array FRQ later.
The Core Processing Pattern
Most data set algorithms follow this structure:
- Initialize tracking variables
- Process each value in the set
- Update tracking variables as needed
- Use the final tracked result
For example, imagine tracking daily temperatures. As you move day by day, you update a running total and keep track of the highest temperature seen so far.
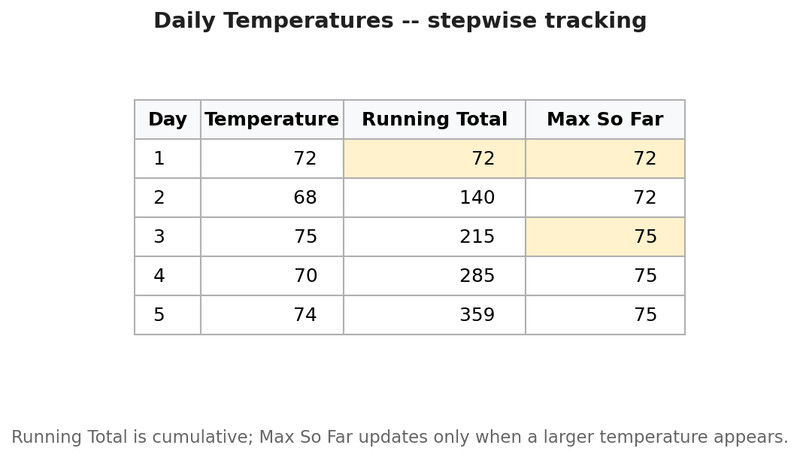
Stepwise temperature tracking with running total and max
Each row represents one step of the algorithm:
- The running total increases as each new temperature is added.
- The max only changes when a larger value appears.
You process one row at a time. That’s it.
Common Types of Data Set Operations
You’ll see the same patterns over and over.
a. Sum
- Start with
sum = 0 - Add each value
- Final
sumis total
b. Average
- Compute sum
- Divide by number of values
- Be careful with integer vs double division
Students lose points here by dividing too early or forgetting to use a double.
c. Count with a Condition
- Start
count = 0 - If value meets condition →
count++ - Final
countis answer
Example idea: Count how many temperatures are below 32.
d. Maximum or Minimum
- Start with the first value as current max
- Compare each new value
- Replace if larger
Huge common mistake: starting max at 0.
That breaks if all numbers are negative.
e. Pattern Detection
Example: longest streak of consecutive absences.
You might track:
currentStreakmaxStreak
Each value updates those trackers.
This kind of logic shows up a lot on tougher FRQs.
3. Representing Data with Tables and Diagrams
Before coding, it helps to visualize the data.
Data can be represented as:
- Tables
- Charts
- Labeled diagrams
Here’s a simple example of a data table showing sales for a week:
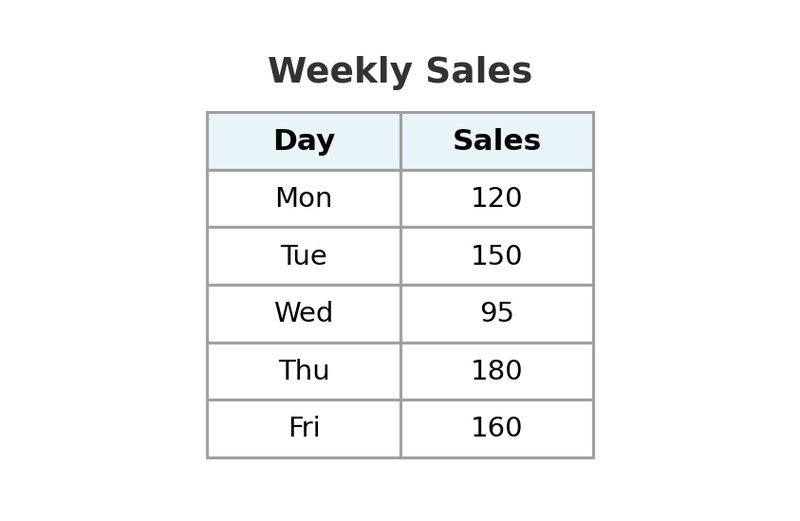
Weekly sales data table
Looking at a table like this helps you:
- See patterns
- Identify what needs to be tracked
- Plan your algorithm
You can even add extra columns like:
- Running total
- Count
- Max so far
That visual planning step makes tracing much easier. On in-class tests or the AP exam, rewriting small data sets as tables on scratch paper can save you from logic mistakes.
4. Planning Before Coding
Strong problem-solvers don’t jump straight into syntax.
They think:
- What question am I answering?
- What do I need to track?
- What changes each time I see a new value?
If the question is “How many days were above 80 degrees?”
You only need:
- A counter
- A condition check
If the question is “What was the highest temperature?”
You need:
- A current max
- A comparison each step
Everything comes back to:
For each value, do the same process.
That mindset prepares you for:
- Arrays
- ArrayLists
- 2D arrays
- Most of FRQ 3 and FRQ 4
5. Edge Cases and Common Mistakes
Even at this conceptual stage, think about edge cases:
- Empty data set
- Only one value
- All values the same
- All negative numbers
Typical mistakes:
- Forgetting to initialize correctly
- Dividing before finishing counting
- Resetting a tracking variable at the wrong time
- Thinking about individual values instead of patterns
Data set problems almost always reduce to:
Process each value, track something, return the result.
