Topic 2.3 Notes – Extracting Information from Data
What Information Is in Data
Start with the core distinction:
- Data = raw facts. Numbers, text, measurements, images, records.
- Information = the facts plus the patterns we extract from them.
A spreadsheet full of daily temperatures is data. A graph showing that average temperatures are rising over 20 years is information.
Programs help humans:
- Detect trends over time
- Find connections between variables
- Use patterns to solve problems or make decisions
One data point rarely tells you much. If one student scores 100%, that says nothing about class performance. With 200 scores, patterns start to appear. Larger data sets make trends easier to see, but size alone does not guarantee accuracy or fairness.
What You Can Extract From Data
Trends
A trend is a pattern across time or groups.
You might see:
- Increase or decrease over time
- Cycles (seasonal patterns)
- Differences between categories
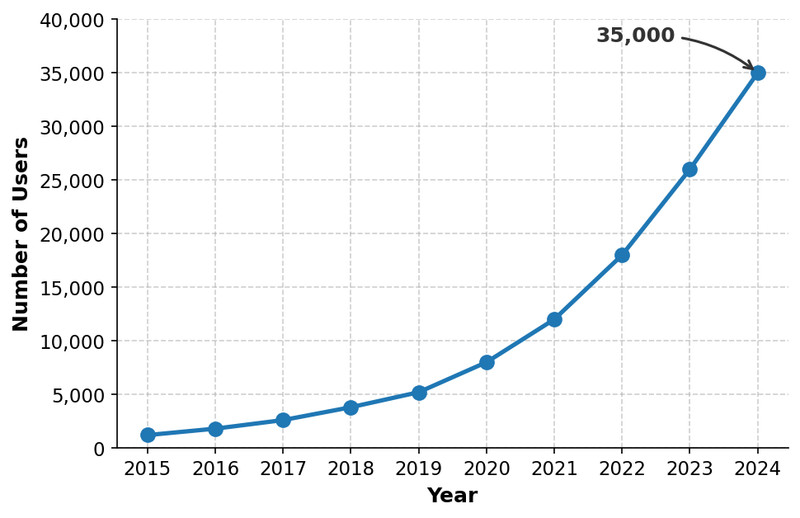
For example, this line graph shows the number of users increasing each year from 2015 to 2024. That steady upward pattern is a trend.
When you see a graph on a quiz, ask:
- Is this going up, down, or staying flat?
- Are certain groups consistently higher or lower?
The AP sometimes gives you a chart and asks what conclusion is supported. Stick to what the data actually shows, not what you assume.
Correlation Between Variables
A correlation means two variables are related.
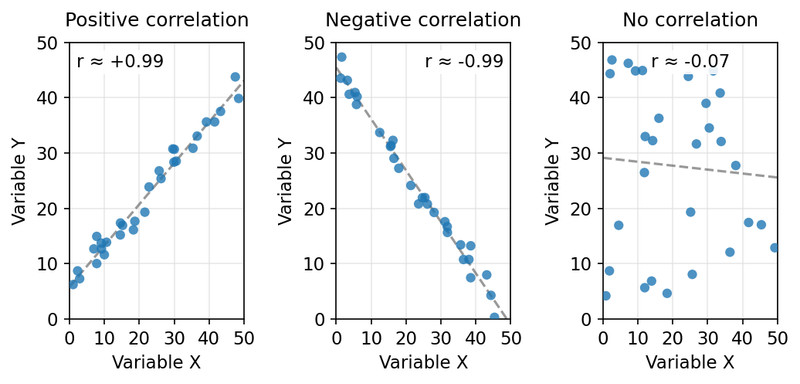
- Positive correlation: as one increases, the other increases.
- Negative correlation: as one increases, the other decreases.
- No correlation: no clear relationship.
These three scatterplots show what each type looks like. One trends upward, one trends downward, and one has points scattered without a clear pattern.
The most tested idea here:
Correlation does not mean causation.
If ice cream sales and sunburns both increase, that does not mean ice cream causes sunburns. A third variable, like temperature, could explain both.
If a question claims one variable causes another based only on a graph, that’s your red flag. Causation requires controlled studies and deeper investigation.
Combining Multiple Data Sources
One data set is often incomplete.
To answer complex questions, you may need to:
- Merge data from different databases
- Compare results from different studies
- Combine data collected in different formats
Challenges:
- Different units (miles vs kilometers)
- Different formats (MM/DD/YYYY vs DD/MM/YYYY)
- Different structures
Programs help clean and merge these so meaningful conclusions can be drawn.
What Metadata Is and Why It Matters
Metadata = data about data.
If the data is a photo, metadata might include:
- Date taken
- Location
- File size
- Author
If the data is a song file:
- Artist
- Length
- Genre
- Release year
Changing metadata does not change the original data. Editing a photo’s date does not change the image itself.
Metadata helps:
- Find information (search by tag or date)
- Organize and sort data
- Manage large collections
- Provide context like when something was created
Without metadata, large data sets would be chaotic and difficult to use effectively.
Challenges in Processing Data
Even powerful programs face limits.
Tool and User Limitations
Processing ability depends on:
- Computing power
- Storage capacity
- Software tools
- User skill
A weak system cannot handle massive or complex data sets efficiently.
Data Quality Problems
Common issues:
- Incomplete data (missing values)
- Invalid data (impossible or wrong format entries)
- Non-uniform data (NY vs New York vs ny)
If users enter data freely, inconsistencies happen.
Data cleaning makes data uniform without changing meaning.
Example: converting all “ny,” “NY,” and “New York” to “New York.”
Cleaning does not change what the data means. It standardizes representation.
Bias in Data
Bias often comes from:
- Who was surveyed
- How data was collected
- What questions were asked
- Social inequalities reflected in the data
Collecting more biased data does not fix bias. If a survey only includes one demographic group, results will reflect that group.
Be ready to explain how bias affects conclusions. The AP loves scenarios where a dataset leaves out part of the population.
Size, Big Data, and Scalability
Larger data sets usually allow stronger pattern detection. With more data, trends become clearer.
Very large data sets:
- Are hard for one computer to process
- May require parallel systems (multiple computers working together)
Scalability means a system can handle growth in data without redesigning everything. If user data doubles, a scalable system can expand storage and processing to keep up.
