Topic 2.4 Notes – Using Programs with Data
Programs Turn Data into Information
Start with the distinction you’ve seen before:
- Data = raw facts (numbers, text, images, records)
- Information/knowledge = meaning you gain after processing that data
A spreadsheet full of temperatures is data. A graph showing that temperatures are rising over time is information.
Programs help because they:
- Work quickly on large data sets
- Apply the same rule to every item (no human inconsistency)
- Let you interactively explore by changing filters or transformations
- Present results in clearer forms like tables or graphs
That processing is what allows patterns to emerge.
Core Data Processing Operations
These are the operations you must recognize. When a question describes a program doing something with data, mentally sort it into one of these.
Transforming Every Element
A transformation applies a rule to each item in a data set.
Examples:
- Multiply every number in a list by 1.08 to add tax.
- Convert every temperature from Celsius to Fahrenheit.
- Add a new field (like graduation year) to every student record.
This doesn’t remove data. It changes it in a consistent way. After transforming, patterns may become clearer. For example, converting raw counts into percentages makes comparisons easier.
Filtering Data
Filtering selects a subset based on a condition.
You might:
- Keep only values greater than 50.
- Show only posts from 2025.
- Select only customers who made more than 3 purchases.
- Filter by category, date, value, or quality.
Filtering is huge on the AP exam. If a prompt says “the program displays only students with GPAs above 3.5,” that’s filtering.
Filtering helps:
- Focus on relevant data
- Remove noise
- Reveal patterns inside specific groups
Combining or Comparing Data
This is when a program:
- Adds up a list (sum)
- Calculates an average
- Finds a maximum or minimum
- Compares two groups
- Merges data from multiple sources
Combining data often reveals trends that aren’t visible in separate lists. For example, merging weather data with crop yield data could show a relationship between rainfall and production.
Visualizing Data
A visualization represents data in a graphical or structured form so patterns are easier to see.
Common examples:
- Bar graphs
- Line graphs
- Tables
- Charts
Here’s a simple example of how a line graph reveals a trend over time:
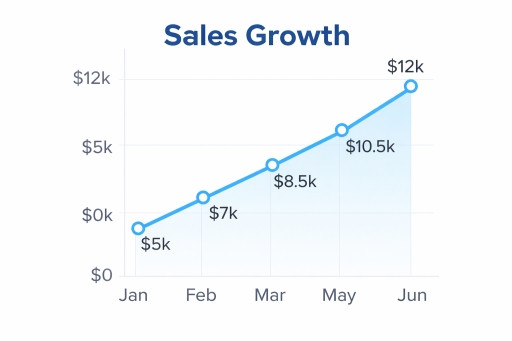
Line graph showing sales growth from January to June
Looking at the upward slope from January to June, you can quickly see that sales are increasing each month. That pattern would be much harder to spot in a raw table of numbers.
The College Board loves asking which representation best communicates a pattern. Often, a graph reveals trends better than text alone.
Tools That Help You Find and Organize Information
Programs make searching and organizing efficient.
Search Tools
Search systems let you:
- Enter keywords
- Apply filters (date, file type, color, etc.)
- Narrow results quickly
They reduce time needed to locate relevant information in massive data sets. Different systems use different filters. An academic database has different search tools than an image search engine.
Spreadsheets
Spreadsheets like Excel or Google Sheets:
- Organize data into rows and columns
- Perform automatic calculations
- Sort data
- Filter subsets
- Generate charts
They’re powerful because they combine transforming, filtering, combining, and visualizing all in one place.
Text Analysis Tools
Data isn’t just numbers. Programs can analyze text to:
- Detect repeated words or themes
- Classify sentiment (positive/negative)
- Group similar documents
That’s still data processing. The program extracts meaning from written language.
Gaining Insight Through Iteration
Data processing is usually iterative and interactive. You don’t just run one step and stop.
A common cycle looks like this:
- Clean or filter messy data
- Transform it
- Visualize or summarize
- Notice a pattern
- Adjust filters or transformations
- Repeat
Each pass can reveal something new.
Cleaning and Preparing Data
Before analysis, data may need to be:
- Filtered to remove errors
- Reformatted into a consistent structure
- Combined from multiple sources
Cleaning improves the reliability of your conclusions.
Clustering and Classifying
Two important processes:
- Clustering = grouping similar data points together (no predefined labels)
- Classifying = assigning items to predefined categories
Both help reveal structure in large data sets.
What Programs Help You Discover
After processing, you might identify:
- Patterns (repeated behaviors)
- Trends (increasing or decreasing over time)
- Correlations (relationships between variables)
- Positive correlation
- Negative correlation
- No correlation
- Outliers (values far from the rest)
Many AP questions describe a scenario and ask what insight the program helps reveal. Your job is to identify the operation and the type of insight gained.
