Topic 1.3 Notes – Production Possibilities Curve
1. What the Production Possibilities Curve Is
The Production Possibilities Curve (PPC), sometimes called the Production Possibilities Frontier (PPF), shows the maximum combinations of two goods an economy can produce with:
- Fixed resources (land, labor, capital, entrepreneurship)
- Fixed technology
- Only two goods
A classic example is guns and butter. Guns represent military or capital goods. Butter represents consumer goods. During World War II, countries shifted production toward guns, which meant less butter. That trade-off is exactly what the PPC shows.
Here’s a standard PPC model. In this example, the economy produces wine (vertical axis) and apples (horizontal axis).
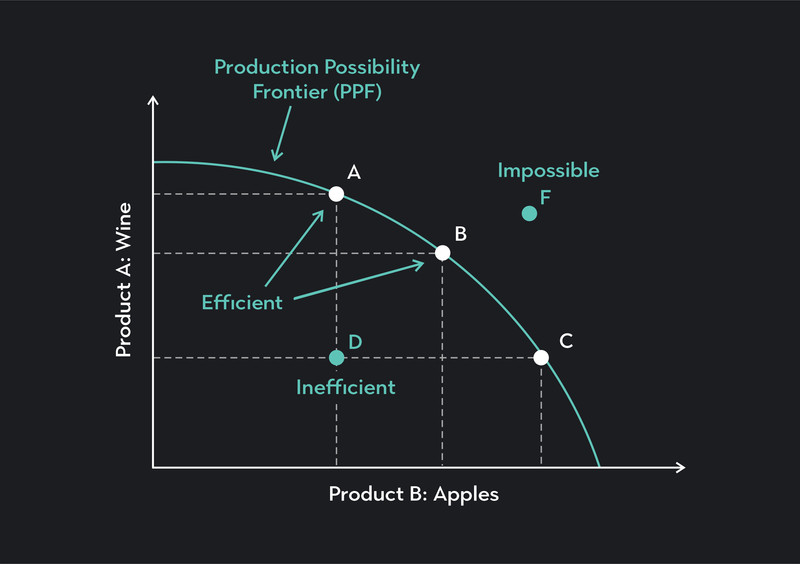
Production Possibilities Frontier (PPF)
What the points mean
- Points A, B, and C (on the curve) → Productive efficiency
All resources are fully used. - Point D (inside the curve) → Inefficient / underutilized resources
Could be unemployment or misallocation. - Point F (outside the curve) → Unattainable
Not possible with current resources and technology.
The PPC is a model of scarcity. Because resources are limited, producing more of one good means giving up some of another. That trade-off is opportunity cost.
2. Opportunity Cost and the Shape of the PPC
Opportunity Cost on the PPC
Opportunity cost is the value of the next best alternative given up.
On the PPC, opportunity cost is measured by the slope of the curve.
If moving from one point to another:
- You gain 4 units of Good A
- You give up 8 units of Good B
Opportunity cost of 1 A = units of B.
On quizzes, they love giving you a table like:
| Combination | Robots | Wheat |
|---|---|---|
| A | 0 | 40 |
| B | 5 | 34 |
| C | 10 | 24 |
From A to B:
- +5 robots
- −6 wheat
Opportunity cost of 1 robot = wheat.
Always write it as “units of what you give up per 1 unit of what you gain.”
Increasing vs Constant Opportunity Cost
The shape of the PPC tells you about opportunity cost.
Increasing Opportunity Cost (Bowed-Out Curve)
A bowed-out PPC shows increasing opportunity cost.
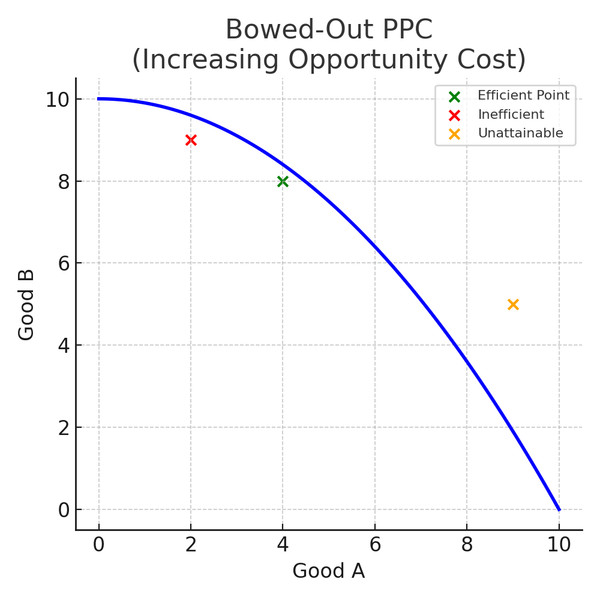
Bowed-out PPC with increasing opportunity cost
- Curve is bowed outward.
- As you produce more of Good A, you give up more and more of Good B.
- Happens because resources are specialized.
Some workers or land are better at producing one good than the other.
Notice how the curve gets steeper as you move to the right. That steeper slope means each additional unit of Good A costs more Good B than the previous one.
Constant Opportunity Cost (Straight Line)
A straight-line PPC shows constant opportunity cost.
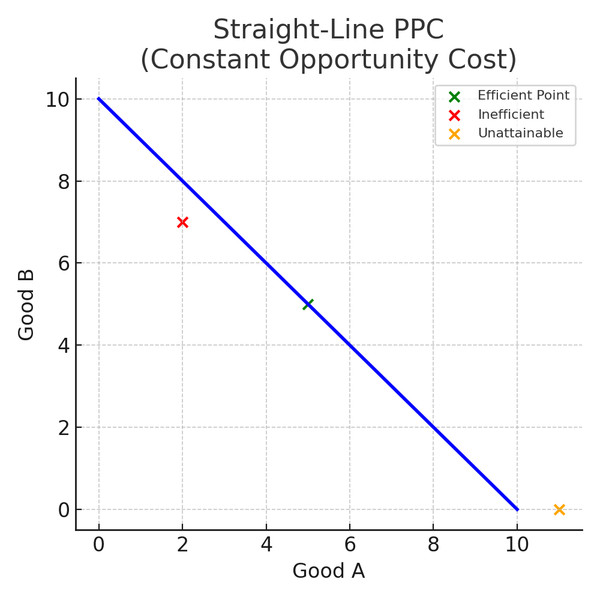
Straight-line PPC with constant opportunity cost
- Resources are perfectly adaptable.
- The trade-off stays the same.
- Slope is constant.
If the curve is straight, opportunity cost does not change as you move along it.
3. Efficiency on the PPC
Productive Efficiency
Any point on the curve.
All resources are fully employed and used efficiently.
Inefficiency
Any point inside the curve.
Common causes:
- High unemployment (like during the Great Depression)
- Underemployment
- Idle factories
The economy could produce more of at least one good without sacrificing the other.
Allocative Efficiency
This is different.
Allocative efficiency is the point on the PPC that reflects what society actually prefers.
The PPC alone does not tell you which point society wants. For example:
- During wartime, a country may prefer more guns.
- In peacetime, more butter.
Every allocatively efficient point is on the curve.
Not every point on the curve is allocatively efficient.
This distinction shows up a lot on MCQs.
4. Economic Growth and Shifts of the PPC
Movement along the curve is a trade-off.
A shift of the curve means productive capacity changes.
Outward Shift (Economic Growth)
In the diagram below, the entire PPC shifts outward, showing economic growth.
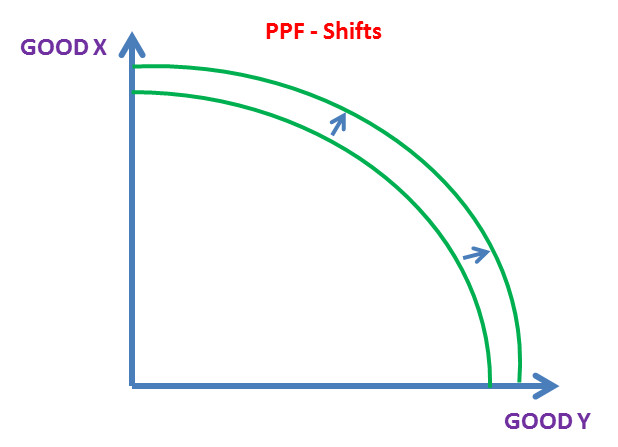
Outward shift of the production possibilities curve
An outward shift means the economy can produce more of both goods.
Causes:
- Increase in quantity of resources (population growth, immigration)
- Improvement in quality of resources (education, human capital)
- More capital goods (factories, machines)
- Technological improvement
Example: The Industrial Revolution dramatically expanded productive capacity.
After World War II, the U.S. experienced long-run growth due to capital accumulation and technological innovation.
Inward Shift (Economic Contraction)
The curve shifts inward when resources decrease:
- War destruction
- Natural disasters
- Major population loss
Technology Affecting One Good
If technology improves for only one good, the curve pivots outward toward that axis.
Example:
- New farming technology increases food output.
- Maximum food increases, but the other good stays the same.
Trade can also expand consumption possibilities beyond the PPC, but the AP focuses mainly on shifts due to resources and technology.
Key Takeaways
Production Possibilities Curve (PPC) / Production Possibilities Frontier (PPF)
A graph showing the maximum combinations of two goods producible with fixed resources and technology.
Assumptions of the PPC
Two goods are produced, resources are fixed, and technology is fixed.
Efficient Output / Productive Efficiency on a PPC
Any point on the curve where all available resources are fully and efficiently used.
Underutilization of Resources / Inefficiency on a PPC
Any point inside the curve where resources are unemployed or not fully used.
Unattainable Output on a PPC
Any point outside the curve that cannot be produced with current resources and technology.
Trade-Offs on a PPC
Getting more of one good requires giving up some of the other good.
Opportunity Cost on a PPC
The amount of one good forgone to gain an additional unit of the other.
Calculating Opportunity Cost from a PPC or Table
Divide the units of one good given up by the units of the other gained.
Slope of the PPC and Opportunity Cost
The curve's slope measures the opportunity cost of producing more of one good.
Constant, Increasing, and Decreasing Opportunity Cost
Constant gives a straight line; increasing bows outward; decreasing bows inward.
Allocative Efficiency on a PPC
The output combination on the curve that best matches society's preferences.
Scarcity Illustrated by the PPC
Limited resources prevent producing every desired combination of goods.
PPC Shifts: Growth, Contraction, and Causes
Changes in resources or technology shift the curve outward for growth or inward for contraction.
Notes
Production Possibilities Curve (PPC) / Production Possibilities Frontier (PPF)
A graph showing the maximum combinations of two goods producible with fixed resources and technology.
Assumptions of the PPC
Two goods are produced, resources are fixed, and technology is fixed.
Efficient Output / Productive Efficiency on a PPC
Any point on the curve where all available resources are fully and efficiently used.
Underutilization of Resources / Inefficiency on a PPC
Any point inside the curve where resources are unemployed or not fully used.
Unattainable Output on a PPC
Any point outside the curve that cannot be produced with current resources and technology.
Trade-Offs on a PPC
Getting more of one good requires giving up some of the other good.
Opportunity Cost on a PPC
The amount of one good forgone to gain an additional unit of the other.
Calculating Opportunity Cost from a PPC or Table
Divide the units of one good given up by the units of the other gained.
Slope of the PPC and Opportunity Cost
The curve's slope measures the opportunity cost of producing more of one good.
Constant, Increasing, and Decreasing Opportunity Cost
Constant gives a straight line; increasing bows outward; decreasing bows inward.
Allocative Efficiency on a PPC
The output combination on the curve that best matches society's preferences.
Scarcity Illustrated by the PPC
Limited resources prevent producing every desired combination of goods.
PPC Shifts: Growth, Contraction, and Causes
Changes in resources or technology shift the curve outward for growth or inward for contraction.
