Topic 2.7 Notes – Market Disequilibrium and Changes in Equilibrium
1. Surpluses, Shortages, and Disequilibrium
You already know that market equilibrium is where Qd = Qs. On a graph, it is the intersection of demand and supply. At that point, total economic surplus (consumer surplus + producer surplus) is maximized.
When Qd ≠ Qs, the market is in disequilibrium.
Shortage
A shortage happens when Qd > Qs, usually because the price is below equilibrium.
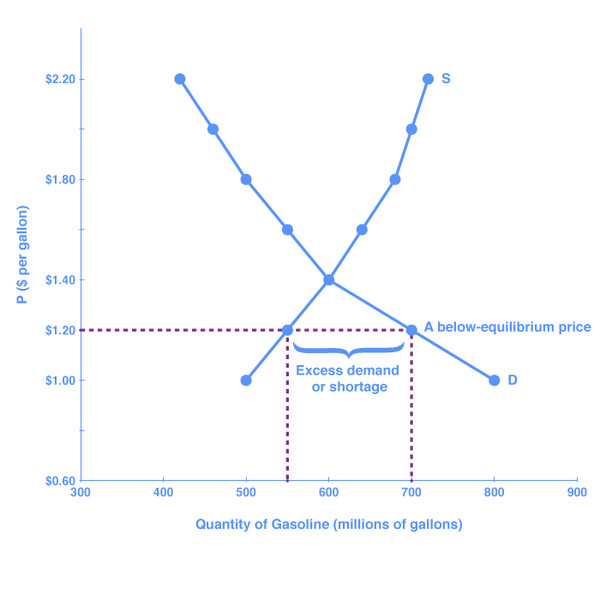
Shortage at a price below equilibrium
In the graph above, the dashed horizontal line shows a price set below equilibrium. At that price, the quantity demanded is to the right of the quantity supplied, creating the horizontal gap labeled excess demand.
What’s happening:
- Buyers want more than firms are selling.
- Buyers compete with each other.
- This creates upward pressure on price.
As price rises:
- Qd falls (law of demand)
- Qs rises (law of supply)
- The market moves back to equilibrium.
Real-world anchor: Gasoline shortages in the 1970s, partly caused by price controls, created lines at gas stations. Price was held below equilibrium, so Qd exceeded Qs.
Surplus
A surplus happens when Qs > Qd, usually because the price is above equilibrium.
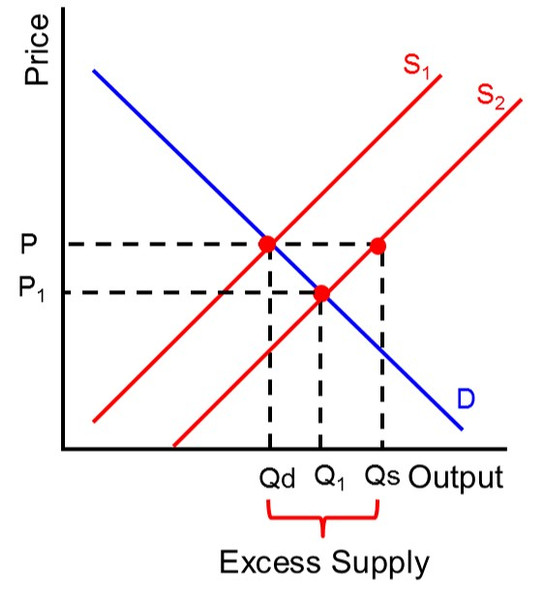
Surplus at a price above equilibrium
Here, the higher price line sits above the equilibrium point. At that price, quantity supplied is to the right of quantity demanded, and the bracketed gap between them represents excess supply.
What’s happening:
- Sellers can’t sell all they produce.
- Sellers compete with each other.
- This creates downward pressure on price.
As price falls:
- Qd rises
- Qs falls
- The market returns to equilibrium.
This self-correcting behavior is central. Competitive markets push themselves back toward equilibrium.
2. Consumer Surplus, Producer Surplus, and Deadweight Loss in Disequilibrium
Quick reminder:
- Consumer Surplus (CS) = area below demand and above price
- Producer Surplus (PS) = area above supply and below price
- Total Surplus = CS + PS, maximized at equilibrium
When price is not at equilibrium, fewer trades happen than should.
Price Below Equilibrium (Shortage)
Only the smaller quantity (Qs) is actually traded. Some mutually beneficial trades between Qs and Qe do not happen.
The lost surplus is deadweight loss (DWL).
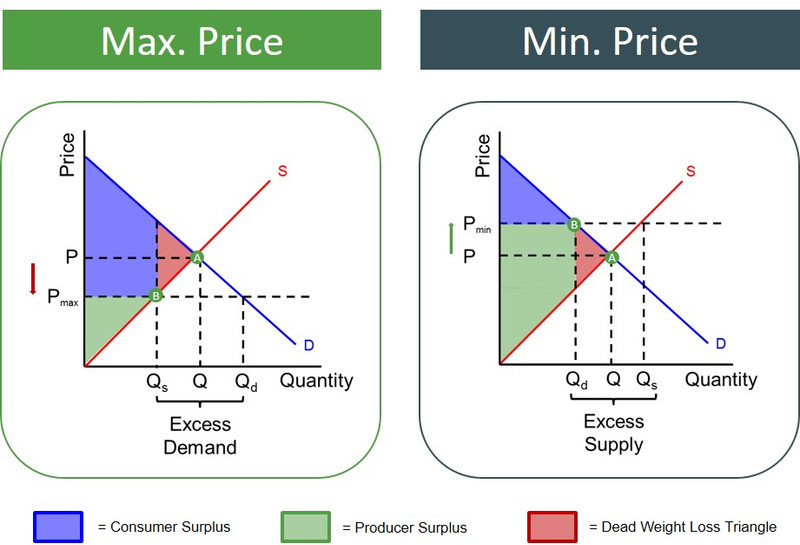
Price ceiling and price floor with deadweight loss
In the left panel, a binding price ceiling creates a shortage. Notice that only Qs is traded, and the red triangle represents the deadweight loss from the trades between Qs and Qe that no longer occur.
Price Above Equilibrium (Surplus)
In the right panel, a binding price floor creates a surplus. Again, fewer units are traded than at equilibrium. The trades between Qe and Qd that would have benefited both sides do not occur. That red triangle is DWL.
Key point: Any time Q traded ≠ Q equilibrium, there is deadweight loss.
3. How Shifts Change Equilibrium, Surplus, and Welfare
Shifts come from determinants, not price itself.
Demand Shifts
If demand increases (curve shifts right):
- P rises
- Q rises
If demand decreases:
- P falls
- Q falls
Price and quantity move in the same direction.
Example: A population boom increases housing demand. Rents rise and more apartments are built.
Surplus effects when demand increases:
- Higher price reduces CS per unit.
- Larger quantity expands total surplus.
- PS increases because price and quantity both rise.
Total surplus changes, but there is no deadweight loss because the market is still at equilibrium.
Supply Shifts
If supply increases (rightward shift):
- P falls
- Q rises
If supply decreases:
- P rises
- Q falls
Price and quantity move in opposite directions.
Example: A spike in oil prices increases production costs for cars. Car supply shifts left. Prices rise, quantity falls.
When supply increases:
- Lower price boosts CS.
- PS per unit falls, but more units are sold.
Elasticity matters. If demand is very inelastic, price changes will be large and surplus effects will be concentrated on one side. The AP sometimes hides this in word problems.
4. Double Shifts and Indeterminate Outcomes
When both curves shift, one outcome may be unclear.
Work through it logically:
- Identify direction of demand shift.
- Identify direction of supply shift.
- Ask what each shift does to price.
- Ask what each shift does to quantity.
- If effects conflict, that variable is indeterminate.
Patterns to know:
- D↑ and S↓ → Price rises, Q indeterminate
- D↓ and S↑ → Price falls, Q indeterminate
- D↑ and S↑ → Quantity rises, P indeterminate
- D↓ and S↓ → Quantity falls, P indeterminate
Always draw it. Students who try to memorize without graphing mix these up.
5. Calculating Changes from Graphs and Tables
From a table:
- Find the equilibrium price where Qd = Qs.
- A shortage equals at the disequilibrium (below-equilibrium) price, not at equilibrium.
- A surplus equals at the disequilibrium (above-equilibrium) price.
From a graph:
- CS and PS are triangles.
- Triangle area .
- Rectangle area .
If equilibrium price is 20 dollars and the demand curve intercept is 40 dollars with Qe = 10:
You must be comfortable reading values directly off a graph. On FRQs, they often change one determinant and expect you to explain who gains, who loses, and whether DWL exists.
Key Takeaways
Market Disequilibrium
A market state where quantity demanded does not equal quantity supplied.
Market Adjustment Toward Equilibrium
Prices rise during shortages and fall during surpluses until quantity demanded equals quantity supplied.
Consumer Surplus
The difference between what buyers are willing to pay and what they actually pay.
Producer Surplus
The difference between the market price and sellers' minimum acceptable price.
Total Economic Surplus
The sum of consumer surplus and producer surplus in a market.
Deadweight Loss
The lost total surplus from producing less or more than the efficient equilibrium quantity.
Disequilibrium vs. Curve Shift
Price controls create shortages or surpluses; shifted curves create a new equilibrium where quantity demanded equals quantity supplied.
Double Shift Analysis
When supply and demand shift together, one outcome may be certain while the other is indeterminate.
Calculating Shortage or Surplus
Subtract quantity supplied from quantity demanded at a given price to find the market imbalance.
Calculating Changes in Consumer and Producer Surplus
Use the areas of the relevant triangles or rectangles before and after the market change.
Elasticity and Changes in Equilibrium
The size of price, quantity, and surplus changes depends on demand and supply elasticities.
Shortage and Surplus
A shortage means quantity demanded exceeds quantity supplied; a surplus means the opposite.
Changes in Equilibrium From Demand and Supply Shifts
Demand shifts change price and quantity together, while supply shifts change them in opposite directions.
Equilibrium Price and Quantity
The market outcome where quantity demanded equals quantity supplied.
Notes
Market Disequilibrium
A market state where quantity demanded does not equal quantity supplied.
Market Adjustment Toward Equilibrium
Prices rise during shortages and fall during surpluses until quantity demanded equals quantity supplied.
Consumer Surplus
The difference between what buyers are willing to pay and what they actually pay.
Producer Surplus
The difference between the market price and sellers' minimum acceptable price.
Total Economic Surplus
The sum of consumer surplus and producer surplus in a market.
Deadweight Loss
The lost total surplus from producing less or more than the efficient equilibrium quantity.
Disequilibrium vs. Curve Shift
Price controls create shortages or surpluses; shifted curves create a new equilibrium where quantity demanded equals quantity supplied.
Double Shift Analysis
When supply and demand shift together, one outcome may be certain while the other is indeterminate.
Calculating Shortage or Surplus
Subtract quantity supplied from quantity demanded at a given price to find the market imbalance.
Calculating Changes in Consumer and Producer Surplus
Use the areas of the relevant triangles or rectangles before and after the market change.
Elasticity and Changes in Equilibrium
The size of price, quantity, and surplus changes depends on demand and supply elasticities.
Shortage and Surplus
A shortage means quantity demanded exceeds quantity supplied; a surplus means the opposite.
Changes in Equilibrium From Demand and Supply Shifts
Demand shifts change price and quantity together, while supply shifts change them in opposite directions.
Equilibrium Price and Quantity
The market outcome where quantity demanded equals quantity supplied.
