Topic 4.2 Notes – Monopoly
1. What a Monopoly Is
A monopoly is a market structure where one firm is the industry.
That firm is a price maker because it faces the entire market demand curve, which is downward sloping.
Core characteristics
- One seller, many buyers
- Unique product (no close substitutes)
- High barriers to entry
- Long-run economic profit possible
- May use non-price competition (advertising, branding)
Why monopolies exist - barriers to entry
These barriers block new firms from entering:
- Legal barriers → patents, copyrights, licenses
- Example: pharmaceutical patents
- Control of key resources → rare inputs
- Economies of scale → large cost advantages at high output
- Government franchise → exclusive rights (local utilities)
Historical anchor:
- Standard Oil controlled oil refining in the late 1800s until broken up under the Sherman Antitrust Act. Antitrust laws exist to limit monopoly power.
2. The Monopoly Graph and Profit Maximization
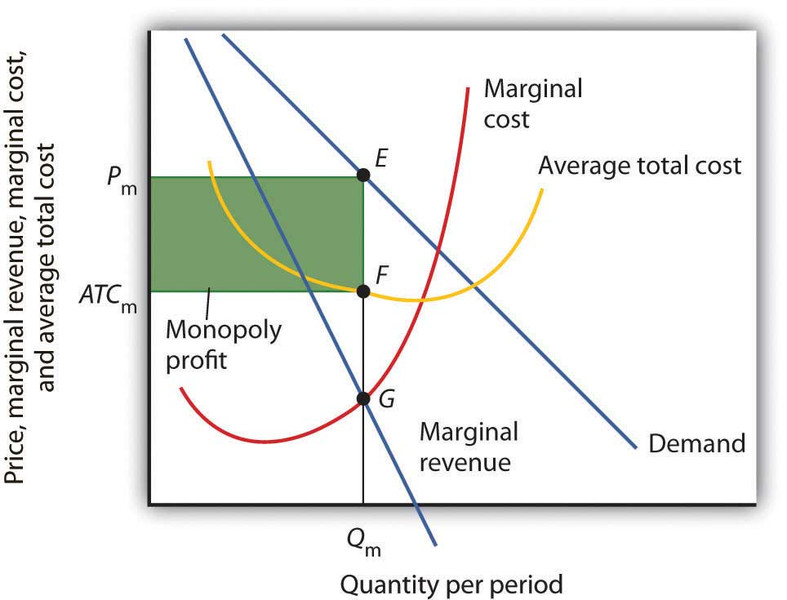
Monopoly profit maximization graph
Why MR Is Below Demand
On the graph above, notice that the marginal revenue curve lies below the demand curve.
To sell one more unit, the firm must lower price for all units sold.
So:
- Marginal revenue < Price
- MR lies below the demand curve.
If the firm could perfectly price discriminate, MR would equal demand, but the standard AP model assumes it cannot.
Profit-Maximizing Output and Price
Monopolies maximize profit in two steps:
- Find where MR = MC → this gives (point where the MR and MC curves intersect)
- Go up to the demand curve at that quantity to find
Important result:
- → monopoly is allocatively inefficient
Calculating Profit or Loss
Profit formula:
On the graph, this is the shaded rectangle between the price on the demand curve and the ATC curve at .
You can also calculate:
- Profit = TR − TC
Quick example (different from your textbook numbers):
If price is 15 dollars, output is 80 units, and ATC is 11 dollars:
- Profit = 320 dollars
Shade that rectangle on the graph.
If ATC is above price, that same rectangle becomes a loss.
Because of barriers to entry, there is no long-run entry to eliminate profits.
3. Surplus and Deadweight Loss
Socially Optimal Output
Look at the graph below. The socially efficient quantity is where the demand curve intersects the marginal cost (MC) curve, labeled . That point represents:

Monopoly output, competitive output, and deadweight loss
In perfect competition:
In monopoly, the firm produces where MR = MC at , then charges the price on the demand curve at that quantity:
- (here shown as )
The monopoly underproduces and overcharges.
Effects on Surplus
- Consumer surplus decreases
- Producer surplus increases per unit
- Deadweight loss (DWL) forms
On the graph, the shaded rectangle represents monopoly profit. The dark triangle between the demand and MC curves from to is the deadweight loss.
DWL represents trades that would benefit buyers and sellers but do not occur.
On FRQs, you may need to calculate:
- Consumer surplus (triangle)
- Producer surplus
- DWL (triangle between D and MC over lost units)
The key inefficiency is that price does not equal marginal cost, so resources are misallocated.
4. Elasticity and Total Revenue
The monopoly demand curve has three regions:
- Elastic
- Unit elastic
- Inelastic
Where MR = 0, demand is unit elastic.
- Above that quantity → elastic region (MR > 0)
- Below that quantity → inelastic region (MR < 0)
A monopoly will never produce in the inelastic region because:
- MR is negative
- MC is positive
- That lowers profit
Connection to Total Revenue:
- In elastic region → lowering price increases TR
- In inelastic region → lowering price decreases TR
If you see a question asking where TR is maximized, look for MR = 0.
5. Natural Monopoly and Regulation
A natural monopoly exists when economies of scale continue over the entire market demand, so one firm can produce at lower cost than multiple firms.
ATC keeps falling across the demand range.
Examples:
- Electricity distribution
- Water utilities
Because breaking them up would raise costs, governments regulate them.
Regulatory Outcomes
| Outcome | Condition | Result |
|---|---|---|
| Profit-maximizing | MR = MC | High price, low output, DWL |
| Socially optimal | P = MC | Efficient, may cause losses if ATC > P |
| Fair-return pricing | P = ATC | Zero economic profit, some DWL remains |
Socially optimal pricing is often imposed with a price ceiling. If ATC is above that price, the firm may need a subsidy.
Fair-return pricing ensures:
Many state utility commissions use this approach.
Key Takeaways
Monopoly
A market structure with one seller protected by barriers to entry.
Barriers to Entry
Obstacles that prevent new firms from entering and competing in a market.
Natural Monopoly
A single firm can supply the entire market at lower cost than multiple firms.
Monopoly Demand and Marginal Revenue
Demand slopes downward, and marginal revenue lies below demand because lowering price affects all units sold.
Profit-Maximizing Output and Price in Monopoly
Produce where MR equals MC, then charge the price on the demand curve.
Price, Marginal Revenue, and Marginal Cost in Monopoly
At the chosen output, price exceeds marginal revenue and is greater than marginal cost.
Consumer Surplus, Producer Surplus, and Deadweight Loss in Monopoly
Consumer surplus shrinks, producer surplus changes, and deadweight loss appears from underproduction.
Fair-Return Price
A regulated price where price equals ATC, so the firm earns normal profit.
Monopoly Profit and Loss
Profit or loss equals the rectangle between price and ATC at the MR = MC output.
Socially Optimal Output and Price
The allocatively efficient point occurs where demand equals marginal cost, unlike monopoly output.
Monopoly Demand Elasticity and Total Revenue
Total revenue is maximized where marginal revenue is zero and demand is unit elastic.
Long-Run Economies of Scale
Average total cost falls as output increases over the entire market demand.
Notes
Monopoly
A market structure with one seller protected by barriers to entry.
Barriers to Entry
Obstacles that prevent new firms from entering and competing in a market.
Natural Monopoly
A single firm can supply the entire market at lower cost than multiple firms.
Monopoly Demand and Marginal Revenue
Demand slopes downward, and marginal revenue lies below demand because lowering price affects all units sold.
Profit-Maximizing Output and Price in Monopoly
Produce where MR equals MC, then charge the price on the demand curve.
Price, Marginal Revenue, and Marginal Cost in Monopoly
At the chosen output, price exceeds marginal revenue and is greater than marginal cost.
Consumer Surplus, Producer Surplus, and Deadweight Loss in Monopoly
Consumer surplus shrinks, producer surplus changes, and deadweight loss appears from underproduction.
Fair-Return Price
A regulated price where price equals ATC, so the firm earns normal profit.
Monopoly Profit and Loss
Profit or loss equals the rectangle between price and ATC at the MR = MC output.
Socially Optimal Output and Price
The allocatively efficient point occurs where demand equals marginal cost, unlike monopoly output.
Monopoly Demand Elasticity and Total Revenue
Total revenue is maximized where marginal revenue is zero and demand is unit elastic.
Long-Run Economies of Scale
Average total cost falls as output increases over the entire market demand.
