Topic 4.5 Notes – Oligopoly and Game Theory
1. What an Oligopoly Is
An oligopoly is a market structure with:
- Few large firms (often 2-10 dominate)
- High barriers to entry (economies of scale, patents, control of key resources, huge startup costs)
- Interdependence (each firm must consider rivals’ reactions)
- Firms are price makers
- Products may be homogeneous (oil) or differentiated (cars, airlines)
- Long-run economic profits are possible
- Allocative inefficiency because
Real-world anchors you should recognize:
- OPEC in oil markets (cartel behavior)
- Coke and Pepsi in soft drinks
- Major U.S. airlines on key routes
- Automobile industry
Because there are so few firms, pricing is strategic. That’s why we use game theory to model behavior.
2. Collusion, Cartels, and the Incentive to Cheat
Firms in an oligopoly would love to act like a monopoly.
- Collusion means firms coordinate on price or output to maximize joint profit.
- A cartel is a formal agreement to collude (like OPEC).
If successful, they produce the monopoly quantity and charge the monopoly price, earning higher joint profits.
The problem is cheating.
Each firm can increase its own profit by secretly lowering price. That temptation creates the Prisoner’s Dilemma structure.
Result:
- Collusion is unstable.
- Prices tend to be lower than monopoly but higher than perfect competition.
- Oligopoly is still inefficient.
This tension between cooperation and self-interest is exactly what game theory models.
3. How Game Theory Models Oligopoly Behavior
A game is a situation where each player’s payoff depends on their own action and the actions of others.
On the AP exam:
- Only two firms (duopoly)
- Only two strategies per firm
- Decisions made simultaneously
- Shown in a payoff matrix (normal form)
Here’s the classic price competition example. Read the first number in each box as Firm A’s profit and the second as Firm B’s.
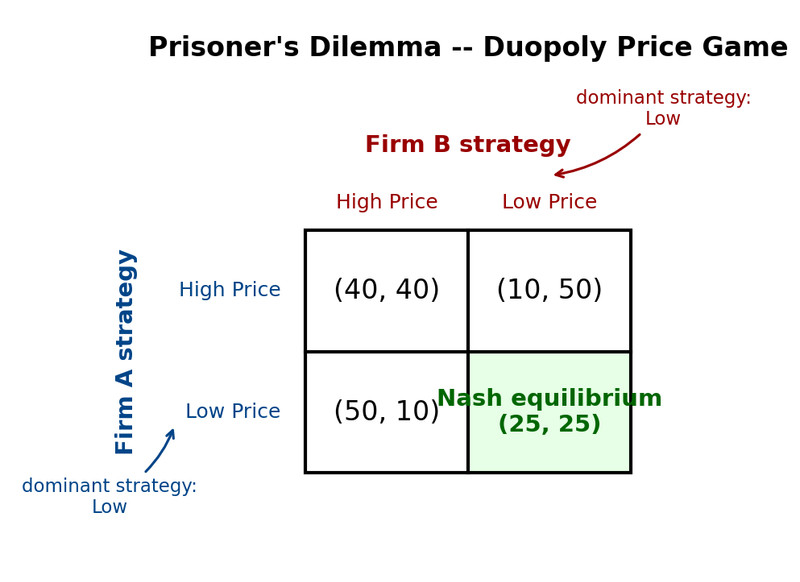
Prisoner’s Dilemma payoff matrix for a duopoly
Each box shows profits for both firms.
Strategy
A strategy is a complete plan of action.
Example: “Always choose low price.”
Dominant Strategy
A firm has a dominant strategy if one action gives a higher payoff no matter what the other firm does.
Using the matrix above:
- If Firm B chooses High → Firm A prefers Low (50 > 40).
- If Firm B chooses Low → Firm A prefers Low (25 > 10).
So Low price is Firm A’s dominant strategy. Same logic for Firm B.
Not every game has dominant strategies. Many FRQs test whether one exists.
Nash Equilibrium
A Nash equilibrium occurs when neither player can improve their payoff by changing their strategy alone.
In the matrix:
- Both choosing Low (25,25) is the Nash equilibrium.
- Neither firm wants to move by itself.
Notice something important:
- (High, High) gives 40,40 which is better jointly.
- But it is unstable because each firm has incentive to undercut.
That’s the Prisoner’s Dilemma.
4. Prisoner’s Dilemma and Why Oligopolies Don’t Reach Monopoly Profit
The Prisoner’s Dilemma explains:
- Why cartels break down
- Why price wars happen
- Why firms often end up earning less than they could through cooperation
Even though firms share a goal of profit maximization, market structure constrains behavior.
This is the core enduring idea of the topic.
On FRQs, when asked why firms don’t achieve the monopoly outcome, connect it directly to:
- Incentive to cheat
- Dominant strategies
- Nash equilibrium
5. Changing Incentives and the Kinked Demand Idea
Calculating the Incentive to Change a Dominant Strategy
Suppose a firm earns:
- 50 by defecting
- 40 by cooperating
To eliminate the dominant strategy to defect, a penalty must be greater than 10 (the payoff difference).
You compare payoffs in that specific cell and find the minimum change that reverses the ranking.
Common AP move:
“How large must a fine be to eliminate the incentive to undercut?”
You subtract the two relevant profits.
Price Leadership and the Kinked Demand Curve
In non-colluding oligopolies, firms may follow a price leader.
If a firm:
- Raises price → rivals don’t follow → demand is elastic.
- Lowers price → rivals match → demand is inelastic.
This creates a kinked demand curve at the current price.
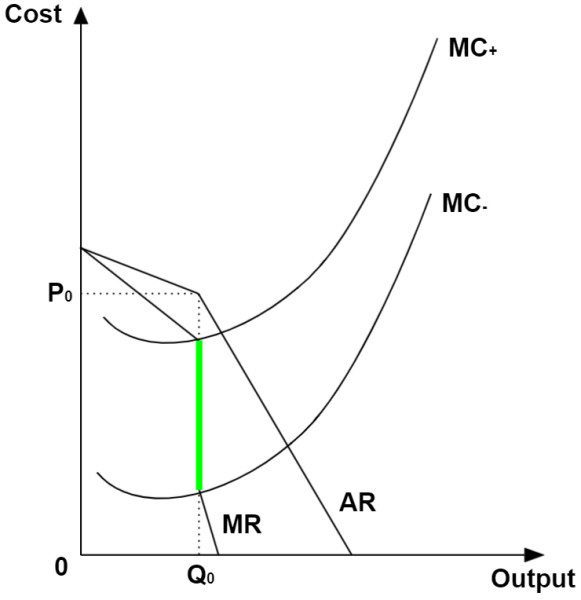
Kinked demand curve and price rigidity in oligopoly
At price P0 and quantity Q0, the demand curve (labeled AR) has a kink. The marginal revenue curve (MR) has a vertical gap. As long as marginal cost shifts within that gap, the profit-maximizing price stays at P0.
This explains price rigidity. Small cost changes may not change price.
The kinked demand curve is mostly conceptual for AP. Game theory is what gets heavily tested.
Key Takeaways
Oligopoly
A market with few interdependent firms, high entry barriers, and inefficient output.
Duopoly
An oligopoly with only two firms competing in the same market.
Interdependence
A condition where each firm's decisions depend on expected reactions from rival firms.
Price Leadership
A situation where one firm sets price changes and rival firms tend to follow.
Game
A situation where each player's payoff depends on both their own and others' choices.
Strategy
A complete plan describing the action a player will take in every situation.
Payoff Matrix / Normal Form
A table showing each player's strategies and the payoff from every strategy combination.
Dominant Strategy
An action that gives a higher payoff no matter what the other player does.
Nash Equilibrium
An outcome where no player can gain by changing alone, given others' choices.
Prisoner's Dilemma
A game where each player chooses self-interest, producing a worse outcome than cooperation.
Noncooperative Outcome
The result when firms act independently, often lowering price and reducing profits.
Incentive to Change a Dominant Strategy
The minimum payoff increase needed to make another action yield a higher payoff.
Collusion and Cartel
An agreement among oligopolists to act like a monopoly by raising price and restricting output.
Cooperative Outcome
The result when players work together to maximize their combined payoffs.
Notes
Oligopoly
A market with few interdependent firms, high entry barriers, and inefficient output.
Duopoly
An oligopoly with only two firms competing in the same market.
Interdependence
A condition where each firm's decisions depend on expected reactions from rival firms.
Price Leadership
A situation where one firm sets price changes and rival firms tend to follow.
Game
A situation where each player's payoff depends on both their own and others' choices.
Strategy
A complete plan describing the action a player will take in every situation.
Payoff Matrix / Normal Form
A table showing each player's strategies and the payoff from every strategy combination.
Dominant Strategy
An action that gives a higher payoff no matter what the other player does.
Nash Equilibrium
An outcome where no player can gain by changing alone, given others' choices.
Prisoner's Dilemma
A game where each player chooses self-interest, producing a worse outcome than cooperation.
Noncooperative Outcome
The result when firms act independently, often lowering price and reducing profits.
Incentive to Change a Dominant Strategy
The minimum payoff increase needed to make another action yield a higher payoff.
Collusion and Cartel
An agreement among oligopolists to act like a monopoly by raising price and restricting output.
Cooperative Outcome
The result when players work together to maximize their combined payoffs.
