Topic 6.5 Notes – Inequality
1. Income Inequality vs Wealth Inequality
Let’s separate the two clearly, because students mix these up all the time.
Income inequality
Income is money earned per year:
- Wages and salaries
- Interest
- Rent
- Profit
It’s a flow variable. It’s measured over time, usually annually.
Income inequality means annual earnings are distributed unevenly across people. It’s influenced by:
- Labor market outcomes
- Education and skills
- Technology
- Tax policy
Income levels and poverty rates vary widely across age, gender, race, education level, and countries. For example:
- College graduates earn more than high school graduates.
- The U.S. has higher income inequality than Scandinavian countries like Sweden and Norway, which use more redistribution.
Wealth inequality
Wealth is assets you own:
- Homes
- Stocks and bonds
- Businesses
- Savings
It’s a stock variable. It accumulates over time.
Wealth inequality is usually greater than income inequality because:
- Wealth compounds through investment returns.
- Wealth is inherited.
Someone can have low income this year but still be wealthy because of assets.
The core idea
Markets distribute income based on productivity, not fairness. That’s the foundation for the rest of this topic.
2. The Lorenz Curve and Gini Coefficient
The Lorenz Curve
The Lorenz curve is a graph of income (or wealth) distribution.
Look at the graph below as you read through how it works.
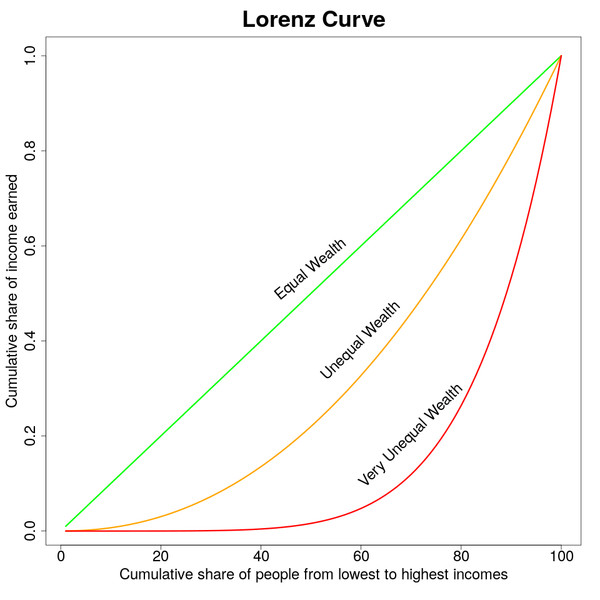
Lorenz curve and equality line
How to read it:
- X-axis: cumulative share of the population (from lowest to highest incomes)
- Y-axis: cumulative share of income earned
The straight 45° line labeled “Equal Wealth” represents perfect equality.
Example: the bottom 40% earn 40% of income.
The bowed curves represent actual distributions.
The more the curve bows away from the equality line, the greater the inequality. In the image, the red curve shows more inequality than the orange curve because it is farther from the equality line.
The Gini Coefficient
The Gini coefficient turns the Lorenz curve into a number.
- 0 = perfect equality
- 1 = perfect inequality
Higher Gini → more inequality.
You might see:
- U.S. has a higher Gini than many European countries.
- Latin American countries historically have had very high Gini coefficients.
- After World War II and during the Great Depression era reforms, U.S. inequality fell due to stronger unions and progressive taxation.
You will not calculate it on the AP exam. You interpret it.
If the Gini increases, inequality increased. That’s it.
3. Why Markets Generate Inequality
This connects back to factor markets.
Factor payments and marginal productivity
Each factor of production is paid its:
Workers with higher productivity earn higher wages.
Capital that produces more output earns higher returns.
If productivity differs, income differs.
Major sources of inequality
- Human capital
Education, training, experience. The “college wage premium” is a classic example. - Social capital
Networks and connections that lead to job or business opportunities. - Inheritance
Wealth passed down across generations increases concentration. - Discrimination
Labor market discrimination lowers wages for certain groups. - Access to financial markets
Wealthy households invest in stocks and real estate. Returns compound over time. - Mobility
Low economic mobility means children tend to stay in the same income group as their parents. - Bargaining power
Labor unions can raise wages.
Monopsony power lets firms suppress wages.
These are all fair game in an FRQ asking you to explain why inequality exists.
4. Tax Structures and Redistribution
Markets create a before-tax distribution. Governments change it with taxes and transfer payments.
Types of taxes
| Type | Definition | Effect on Inequality | Example |
|---|---|---|---|
| Progressive | Higher income → higher % taxed | Reduces inequality | U.S. federal income tax (tax brackets) |
| Proportional | Same % for all incomes | Leaves relative inequality unchanged | Flat 20% income tax |
| Regressive | Lower income pays higher % of income | Increases inequality | Sales tax, payroll tax |
Progressive taxes expanded during the New Deal and after WWII, which reduced inequality in the mid-20th century U.S.
Transfer payments
Transfer payments are government payments not tied to production:
- Welfare
- Unemployment benefits
- Social Security
They increase income for lower-income households and shift the Lorenz curve closer to equality.
Key Takeaways
Income Inequality
An uneven distribution of earnings among individuals or households in an economy.
Wealth Inequality
An uneven distribution of assets such as property, savings, and investments.
Poverty Rate
The percentage of people whose income falls below the poverty threshold.
Lorenz Curve
A graph showing the cumulative distribution of income or wealth compared with perfect equality.
Gini Coefficient
A number from 0 to 1 measuring inequality, with higher values showing greater inequality.
Value of Marginal Product
The extra revenue generated by employing one more unit of a factor of production.
Human Capital
The education, training, skills, and experience that increase a worker's productivity and earnings.
Social Capital
Networks and relationships that provide economic opportunities, information, and support.
Inheritance
Wealth or assets passed from one generation to another.
Discrimination
Unequal treatment based on group identity that limits wages, hiring, or advancement.
Access to Financial Markets
The ability to borrow, save, invest, and build wealth through financial institutions.
Economic Mobility
The ability to move up or down the income or wealth distribution over time.
Bargaining Power
The ability of workers, firms, or family members to influence wages and income distribution.
Progressive, Regressive, and Proportional Taxes
Progressive takes a higher share from higher incomes; regressive from lower incomes; proportional the same share from all.
Transfer Payments
Government payments to individuals without receiving current goods or services in return.
Notes
Income Inequality
An uneven distribution of earnings among individuals or households in an economy.
Wealth Inequality
An uneven distribution of assets such as property, savings, and investments.
Poverty Rate
The percentage of people whose income falls below the poverty threshold.
Lorenz Curve
A graph showing the cumulative distribution of income or wealth compared with perfect equality.
Gini Coefficient
A number from 0 to 1 measuring inequality, with higher values showing greater inequality.
Value of Marginal Product
The extra revenue generated by employing one more unit of a factor of production.
Human Capital
The education, training, skills, and experience that increase a worker's productivity and earnings.
Social Capital
Networks and relationships that provide economic opportunities, information, and support.
Inheritance
Wealth or assets passed from one generation to another.
Discrimination
Unequal treatment based on group identity that limits wages, hiring, or advancement.
Access to Financial Markets
The ability to borrow, save, invest, and build wealth through financial institutions.
Economic Mobility
The ability to move up or down the income or wealth distribution over time.
Bargaining Power
The ability of workers, firms, or family members to influence wages and income distribution.
Progressive, Regressive, and Proportional Taxes
Progressive takes a higher share from higher incomes; regressive from lower incomes; proportional the same share from all.
Transfer Payments
Government payments to individuals without receiving current goods or services in return.
