Topic 2.1 Notes – Demand
1. What Demand Is
A market brings together buyers (demand) and sellers (supply) to exchange goods and services. For that to work, you need a system of property rights so people can legally own and transfer goods. Without that, markets break down.
Demand is the relationship between the price of a good and the quantity consumers are willing and able to buy at each price.
- Willing means they want it.
- Able means they have the income to pay for it.
If I want a 5,000-dollar laptop but only have 200 dollars, that’s desire, not demand.
Consumers respond to incentives (like prices) and face constraints (income, time, laws). Demand is just that response shown in price-quantity form.
Demand Schedule and Demand Curve
- Demand schedule = a table listing price-quantity pairs.
- Demand curve = a graph of that relationship.
Here’s a simple demand curve based on a schedule of price-quantity pairs.
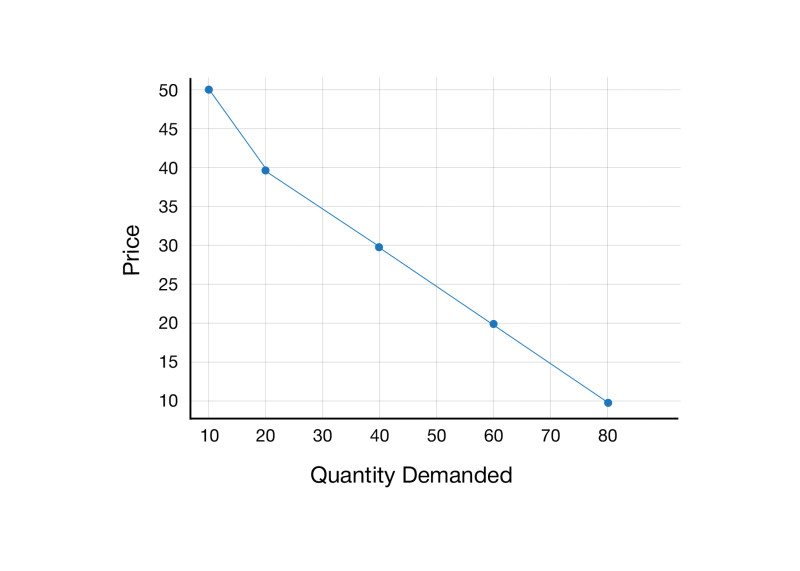
Key features:
- Price on the y-axis
- Quantity on the x-axis
- Curve slopes downward
Individual vs. Market Demand
An individual demand curve shows one consumer’s choices.
Market demand is the horizontal sum of all individual demand curves. At each price, add up everyone’s quantity.
In the graph below, a dashed horizontal price line shows the same price for two consumers. The quantities labeled and are added horizontally to get the market quantity .
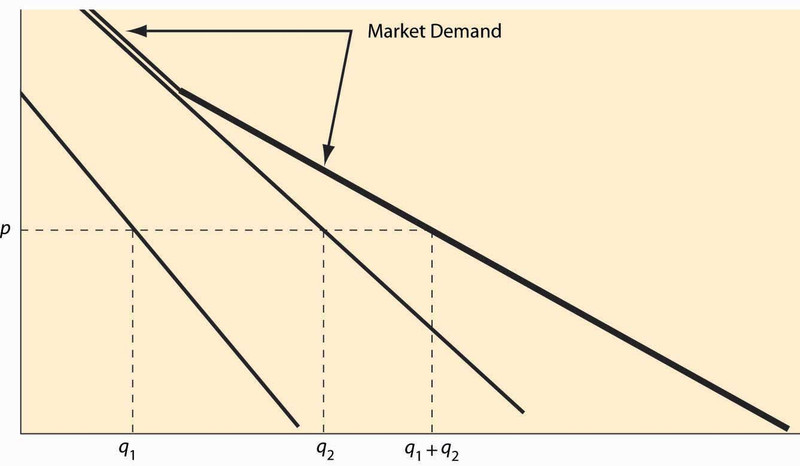
On an FRQ, if they give you two consumers and ask for market demand, you add quantities at each price. Not prices. Quantities.
2. The Law of Demand and Why the Curve Slopes Down
Law of Demand
As price increases, quantity demanded decreases.
As price decreases, quantity demanded increases.
A change in the good’s own price causes a movement along the demand curve.
Why does this happen? Three forces work together.
Substitution Effect
If the price of a good rises, consumers switch to a substitute.
- If the price of coffee rises, some people buy tea instead.
- Relative price changed, so behavior changes.
Income Effect
When price changes, purchasing power changes.
- If gas falls from 4 dollars to 2 dollars per gallon, your income stretches further.
- You can afford more of it.
A lower price feels like a small increase in real income.
Diminishing Marginal Utility
The law of diminishing marginal utility says each additional unit consumed gives less extra satisfaction.
- First slice of pizza is great.
- Fourth slice is less exciting.
Consumers buy more only if price falls to match that lower marginal benefit. That’s why demand slopes downward.
On the AP exam, if they ask why demand is downward sloping, mentioning substitution effect + income effect is usually enough. Diminishing marginal utility strengthens the explanation.
3. Demand vs. Quantity Demanded
This distinction shows up constantly.
Quantity demanded
- A specific amount at a specific price
- A single point on the curve
- Changes only when price changes
- Movement along the curve
Demand
- The entire relationship
- The whole curve
- Changes when a non-price determinant changes
- Shift of the curve
If the question says the price of the good changed, do not shift the curve. That mistake costs points every year.
4. Determinants of Demand and Curve Shifts
A change in any determinant shifts the entire demand curve.
Increase in demand → shift right
Decrease in demand → shift left
At every price, quantity changes.
The Six Shifters
You might remember I-N-S-E-C-T.
| Determinant | What Happens |
|---|---|
| Income | Normal good: income ↑ → demand ↑. Inferior good: income ↑ → demand ↓. |
| Number of Consumers | Population growth → demand increases. |
| Substitutes | Price of substitute ↑ → demand for this good ↑. |
| Expectations | Expect higher future prices → demand now ↑ (seen in housing markets before 2008). |
| Complements | Price of complement ↑ → demand ↓ (gas and SUVs). |
| Tastes | Trends, advertising, cultural shifts change demand. |
Real example: In 2008, gas prices spiked. Quantity demanded of gas fell in the short run, which was a movement along the curve. Over time, demand for fuel-efficient cars shifted right.
Taxes are interesting. A per-unit tax on sellers shifts the supply curve up by the amount of the tax, leading to a new equilibrium at a higher price and lower quantity. The demand curve does not shift.
5. Incentives, Constraints, and Buyer Behavior
Everything in this topic connects back to one idea.
- Consumers respond to price incentives.
- They face income constraints.
- They operate within legal and regulatory frameworks.
Every purchase has an opportunity cost. If you spend 50 dollars on concert tickets, that’s 50 dollars not spent elsewhere. Demand reflects those trade-offs.
When incentives or constraints change, behavior changes. Sometimes that means moving along the curve. Sometimes it means shifting the entire curve.
That distinction is the heart of Topic 2.1.
Key Takeaways
Demand
The relationship between a good's price and the quantity consumers are willing and able to buy.
Law Of Demand
As price rises, quantity demanded falls; as price falls, quantity demanded rises, ceteris paribus.
Demand Curve
A downward-sloping graph showing the relationship between price on the y-axis and quantity demanded on the x-axis.
Quantity Demanded Vs. Demand
Quantity demanded is one amount at one price; demand is the entire relationship shown by the curve.
Movement Along The Demand Curve
A change in quantity demanded caused only by a change in the good's own price.
Shift In Demand
A leftward or rightward change of the entire curve caused by a nonprice determinant.
Determinants Of Demand
Income, number of consumers, substitutes, expectations, complements, and tastes change demand at every price.
Normal Good Vs. Inferior Good
For normal goods demand rises with income; for inferior goods demand falls as income rises.
Substitutes Vs. Complements
Substitutes are used in place of each other; complements are used together.
Substitution Effect
When a good becomes relatively more expensive, consumers buy less of it and more of alternatives.
Income Effect
A price change changes purchasing power, altering how much consumers buy of the good.
Diminishing Marginal Utility
Each additional unit consumed gives less extra satisfaction than the previous unit.
Market Demand
The total quantity all consumers demand at each price, found by summing individual demands.
Demand Schedule
A table showing the quantity consumers will buy at different prices.
Notes
Demand
The relationship between a good's price and the quantity consumers are willing and able to buy.
Law Of Demand
As price rises, quantity demanded falls; as price falls, quantity demanded rises, ceteris paribus.
Demand Curve
A downward-sloping graph showing the relationship between price on the y-axis and quantity demanded on the x-axis.
Quantity Demanded Vs. Demand
Quantity demanded is one amount at one price; demand is the entire relationship shown by the curve.
Movement Along The Demand Curve
A change in quantity demanded caused only by a change in the good's own price.
Shift In Demand
A leftward or rightward change of the entire curve caused by a nonprice determinant.
Determinants Of Demand
Income, number of consumers, substitutes, expectations, complements, and tastes change demand at every price.
Normal Good Vs. Inferior Good
For normal goods demand rises with income; for inferior goods demand falls as income rises.
Substitutes Vs. Complements
Substitutes are used in place of each other; complements are used together.
Substitution Effect
When a good becomes relatively more expensive, consumers buy less of it and more of alternatives.
Income Effect
A price change changes purchasing power, altering how much consumers buy of the good.
Diminishing Marginal Utility
Each additional unit consumed gives less extra satisfaction than the previous unit.
Market Demand
The total quantity all consumers demand at each price, found by summing individual demands.
Demand Schedule
A table showing the quantity consumers will buy at different prices.
