Topic 4.1 Notes – Introduction to Imperfectly Competitive Markets
1. What Imperfectly Competitive Markets Are
You already know perfect competition: many firms, identical products, price takers, and in long-run equilibrium we get P = MR = MC, which means allocative efficiency.
Imperfect competition happens when one or more of those assumptions breaks.
Core characteristics
- Fewer firms (sometimes one, sometimes a few)
- Market power → firms are price makers
- Barriers to entry
- Often product differentiation
- P > MC at the profit-maximizing output → inefficiency
Here are the four market structures you need to recognize:
- Monopoly
- One seller, unique product
- Examples: local utility companies, DeBeers diamonds, patented drugs, Windows operating system.
- Oligopoly
- A few large firms (often fewer than 10)
- Examples: airlines, cereal companies, automobile manufacturers, cell phone carriers, cable TV.
- Monopolistic competition
- Many firms, but differentiated products
- Examples: restaurants, clothing brands, hairdressers, makeup companies.
- Monopsony (factor market)
- One buyer of a resource
- Example: a single large employer in a small town.
All of them share one key trait: the firm faces a downward-sloping demand curve.
2. Price Makers and the Downward-Sloping Demand Curve
In perfect competition, the firm’s demand curve is perfectly elastic. Here, it isn’t.
If an imperfectly competitive firm wants to sell more output, it must lower its price.
That means:
- Demand is downward sloping
- Marginal revenue (MR) is below demand
- P ≠ MR
Here’s what that looks like on a monopoly-style graph.
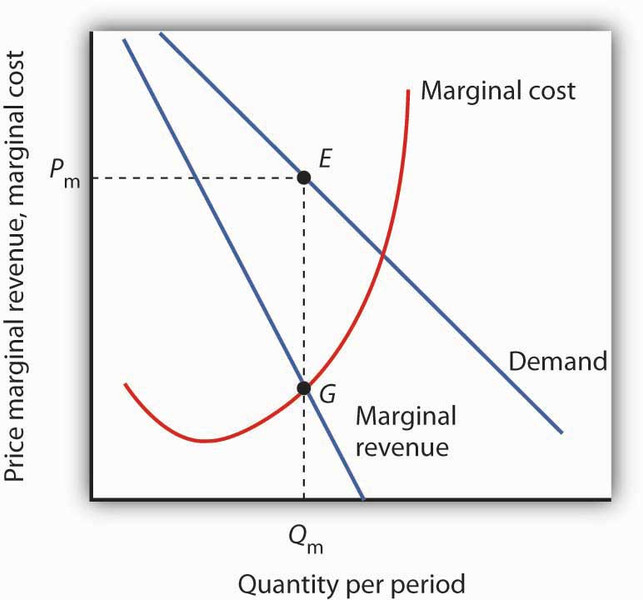
Monopoly profit maximization: MR = MC, price from demand
Why is MR below demand?
When the firm lowers price to sell one more unit:
- It gains revenue from that extra unit
- It loses revenue on all previous units because price fell
So MR < P. On the graph, that’s why the marginal revenue curve lies below the demand curve at every positive quantity.
The profit rule stays the same:
In the graph, that happens where the MR and MC curves intersect. The firm then goes up to the demand curve to find the price it can charge for that quantity.
Students constantly write “produce where P = MC” for monopolies. That is wrong. Produce where MR = MC, charge the demand-curve price.
Fun fact you may hear about but don’t need for AP: the Lerner Index measures market power using how much P exceeds MC.
3. Inefficiency and Deadweight Loss
In imperfect competition, at the profit-maximizing quantity:
- MR = MC
- But since MR < P → P > MC
That gap is the problem.
Allocative efficiency happens when:
If P > MC, society values the good more than it costs to produce, but the firm is restricting output to keep price high.
Result:
- Output is too low
- Price is too high
- Some mutually beneficial trades do not happen
- We get deadweight loss (DWL)
The graph below shows the monopoly outcome compared to the efficient outcome. Notice that the firm produces at where MR = MC, charges from the demand curve, and produces less than the efficient quantity where demand intersects MC. The blue triangle between the demand and MC curves from to is the deadweight loss.
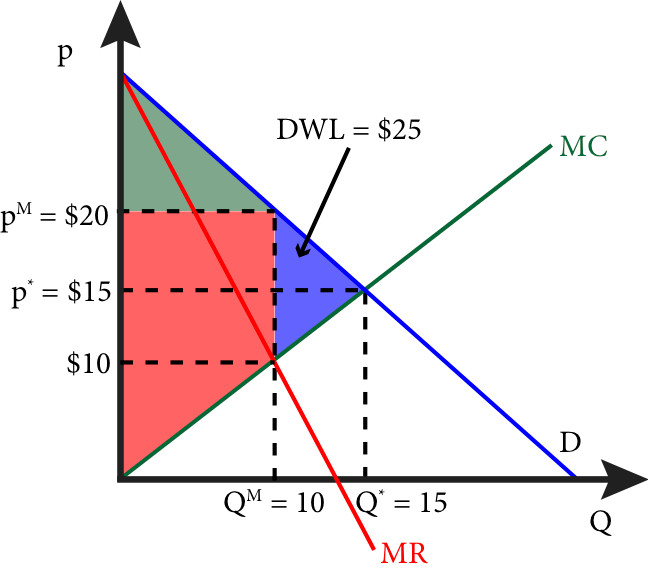
Monopoly deadweight loss
AP-style explanation you should be ready to write in one clean sentence:
“At the monopoly quantity, price exceeds marginal cost, so the market is allocatively inefficient.”
4. Barriers to Entry and Why They Matter
If firms earn economic profit, why don’t new firms enter?
Because of barriers to entry, which protect market power.
Major barriers
- High fixed/start-up costs
Airlines need planes, pilots, licenses. Utilities need infrastructure. - Economies of scale
Large firms produce at lower average cost. This creates natural monopolies, like electricity grids. - Legal barriers
Patents, copyrights, licenses, government franchises. - Exclusive ownership of key resources
Control of raw materials or geographic advantages. - Brand loyalty / reputation (non-price competition)
Advertising builds customer loyalty, making entry harder.
Barriers reduce entry, limit competition, and allow firms to earn long-run economic profit (except monopolistic competition, which breaks even in the long run).
Big Picture Comparison
| Feature | Perfect Competition | Imperfect Competition |
|---|---|---|
| Firms | Many | One or few |
| Product | Identical | Often differentiated |
| Demand curve | Perfectly elastic | Downward sloping |
| Price control | Price taker | Price maker |
| Profit rule | P = MR = MC | MR = MC, then charge P |
| Efficiency | P = MC | P > MC → DWL |
Market structure shapes behavior. Even though every firm wants to maximize profit, the structure determines whether that leads to efficiency or inefficiency.
Key Takeaways
Imperfect Competition
Market structures where firms have price-setting power and price exceeds marginal cost.
Types of Imperfectly Competitive Markets
Monopoly: one seller; oligopoly: few dominant sellers; monopolistic competition: many sellers with differentiated products; monopsony: one buyer in a factor market.
Inefficiency in Imperfect Competition
Output is allocatively inefficient because consumers pay a price greater than marginal cost.
High Fixed Costs as a Barrier to Entry
Large upfront expenses deter new firms from entering because startup is too costly.
Legal Barriers to Entry
Government protections like patents or licenses give firms exclusive rights and block competitors.
Exclusive Ownership of Key Resources
Control of essential inputs prevents rivals from producing and entering the market.
Economies of Scale as a Barrier to Entry
Large firms produce at lower average cost, making it hard for smaller entrants to compete.
Demand and Marginal Revenue in Imperfect Competition
Demand slopes downward, and marginal revenue lies below demand because lowering price affects all units sold.
Barriers to Entry
Obstacles like high startup costs, legal restrictions, and resource control discourage new firms from entering.
Product Differentiation and Non-Price Competition
Firms sell distinct products and compete through advertising, quality, or service instead of price.
Deadweight Loss
The loss of total surplus caused when output is below the socially efficient level.
Notes
Imperfect Competition
Market structures where firms have price-setting power and price exceeds marginal cost.
Types of Imperfectly Competitive Markets
Monopoly: one seller; oligopoly: few dominant sellers; monopolistic competition: many sellers with differentiated products; monopsony: one buyer in a factor market.
Inefficiency in Imperfect Competition
Output is allocatively inefficient because consumers pay a price greater than marginal cost.
High Fixed Costs as a Barrier to Entry
Large upfront expenses deter new firms from entering because startup is too costly.
Legal Barriers to Entry
Government protections like patents or licenses give firms exclusive rights and block competitors.
Exclusive Ownership of Key Resources
Control of essential inputs prevents rivals from producing and entering the market.
Economies of Scale as a Barrier to Entry
Large firms produce at lower average cost, making it hard for smaller entrants to compete.
Demand and Marginal Revenue in Imperfect Competition
Demand slopes downward, and marginal revenue lies below demand because lowering price affects all units sold.
Barriers to Entry
Obstacles like high startup costs, legal restrictions, and resource control discourage new firms from entering.
Product Differentiation and Non-Price Competition
Firms sell distinct products and compete through advertising, quality, or service instead of price.
Deadweight Loss
The loss of total surplus caused when output is below the socially efficient level.
