Topic 2.9 Notes – International Trade and Public Policy
1. Opening to Trade and the World Price
In autarky (no trade), equilibrium is where domestic supply (S) and domestic demand (D) intersect.
When trade opens, a small country becomes a price taker in world markets. It accepts the world price (Pw) and cannot influence it. That price may be above or below the old domestic equilibrium.
The three panels below show both possibilities. Focus on the left panel for an importing country and the right panel for an exporting country.
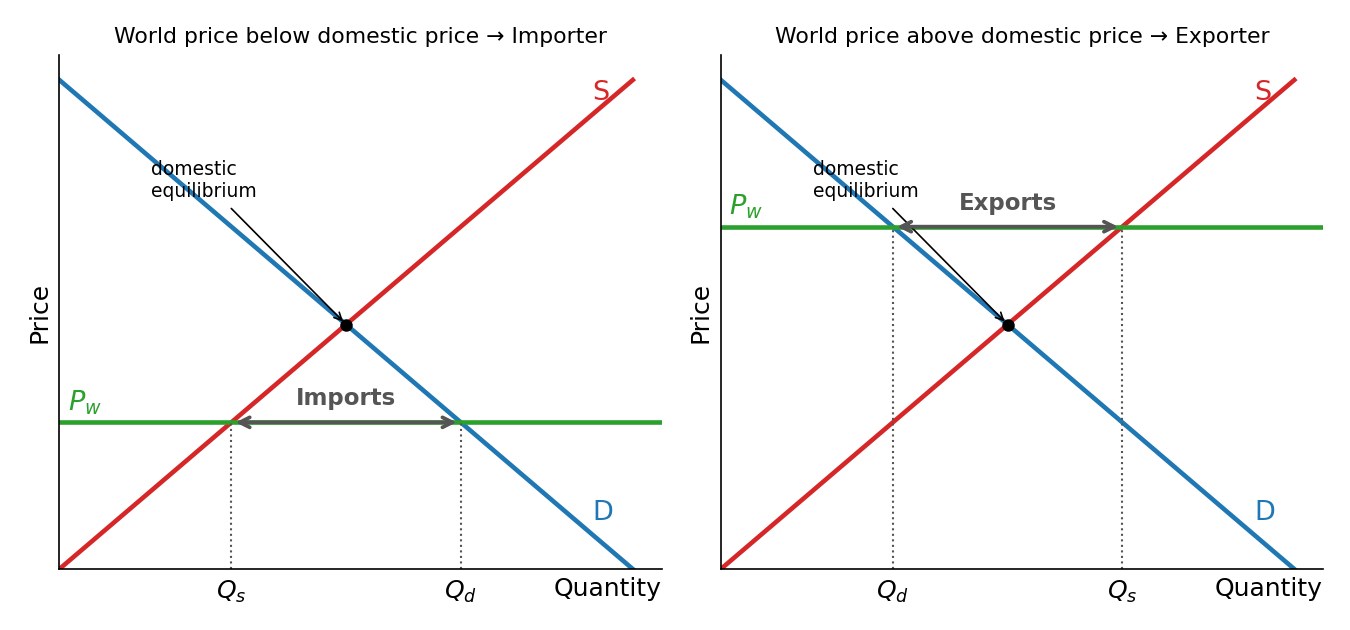
World price with imports (left) and exports (right)
If domestic equilibrium price → Importer
- Price falls to
- increases, decreases
- Imports =
- Consumer surplus increases
- Producer surplus decreases
- Total economic surplus increases (gains from trade)
This is the left panel. The horizontal world price line sits below the autarky equilibrium, and the gap between and at is labeled imports.
Think of the U.S. importing shoes or electronics from China. Lower world prices help consumers.
If domestic equilibrium price → Exporter
- Price rises to
- increases, decreases
- Exports =
- Producer surplus increases
- Consumer surplus decreases
- Total economic surplus increases
This is the right panel. The world price is above the autarky equilibrium, and the distance between and at represents exports.
Trade agreements like NAFTA (now USMCA) and groups like ASEAN reduce barriers so countries can specialize and trade more efficiently. The U.S. trades heavily with China, Canada, and Mexico, often because producing certain goods abroad is cheaper.
The key pattern: trade creates winners and losers, but total surplus rises.
2. Tariffs
A tariff is a tax on imports. Governments use tariffs to protect domestic producers or influence trade flows.
In an importing country, a tariff raises the domestic price above the world price , as shown in the graph below.
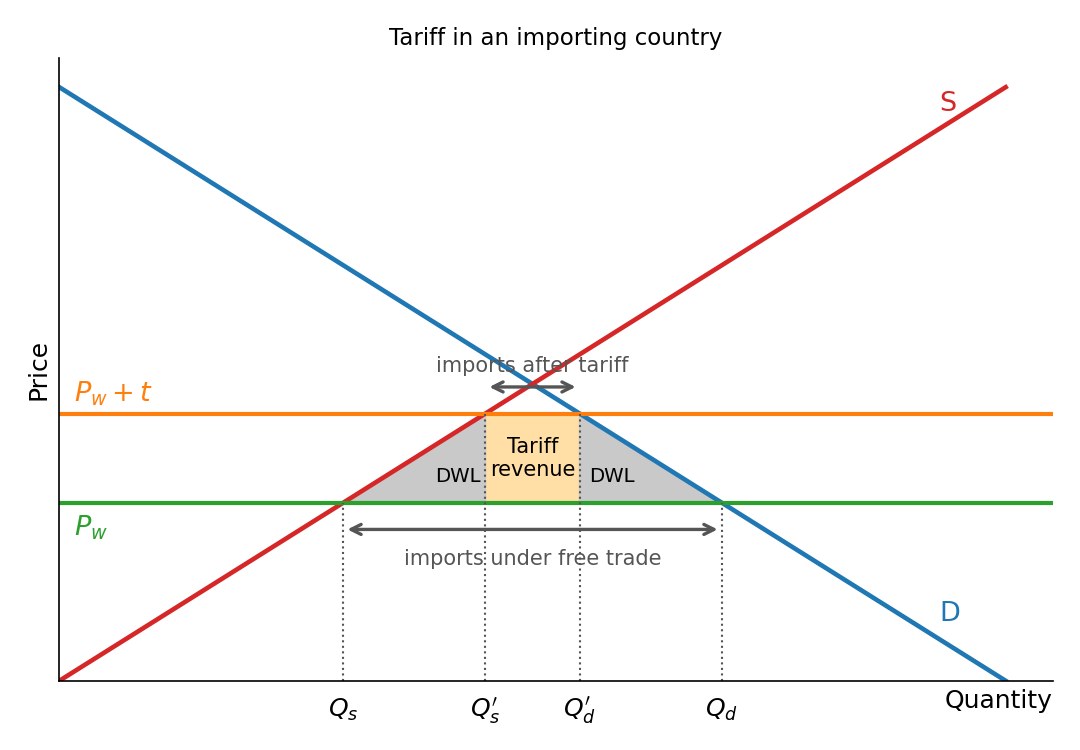
Tariff in an importing country: price rises from Pw to Pw + t, imports shrink, tariff revenue and two deadweight-loss triangles
What changes after a tariff?
- Price rises from to
- falls
- rises
- Imports shrink
Surplus effects
- Consumer surplus decreases
- Producer surplus increases
- Government revenue equals
- Deadweight loss appears
- One triangle from overproduction
- One triangle from underconsumption
Total economic surplus falls compared to free trade.
Real example: In 2018, the U.S. imposed tariffs on steel and aluminum imports from multiple countries (including Canada, Mexico, the EU, and others under Section 232). Domestic steel producers benefited, consumers and firms using steel paid higher prices, and the government collected tariff revenue.
On a test, you may be given numbers from a graph. If imports after a tariff are 30 units and the tariff is 4 dollars per unit, revenue is dollars. The AP often hides this in a graph and expects you to read the quantities correctly.
3. Import Quotas
A quota sets a maximum quantity of imports.
Instead of taxing each unit, the government directly limits how much can enter.
Graphing quotas is not required on the AP exam, but you must know the effects.
Market effects of a quota
- Imports are capped at the quota amount
- Total supply shrinks
- Price rises above
- decreases
- increases
Surplus effects
- Consumer surplus decreases
- Producer surplus increases
- Deadweight loss occurs
The big difference from tariffs is who gets the extra money from the higher price.
With a tariff, the government clearly gets revenue. With a quota, the extra profit, called quota rents, may go to:
- Foreign producers
- Domestic import license holders
- The government if licenses are auctioned
The U.S. has used quotas on goods like sugar and textiles, raising domestic prices above world prices.
4. Free Trade vs Tariffs vs Quotas
| Policy | Price | Imports | Gov Revenue | Deadweight Loss | Who Gains |
|---|---|---|---|---|---|
| Free Trade | Maximum | None | None | Consumers (importers) | |
| Tariff | Above | Reduced | Yes | Yes | Producers + Gov |
| Quota | Above | Fixed limit | Not guaranteed | Yes | Producers + quota holders |
Every policy changes price, quantity, consumer surplus, producer surplus, and total economic surplus. Government policy shapes incentives, and incentives shape market outcomes.
Key Takeaways
Autarky
A situation where a country does not trade internationally and relies only on domestic markets.
World Price
The price of a good on the international market, which domestic buyers and sellers take as given.
Imports in a Competitive Market
The amount bought from foreign producers, equal to domestic quantity demanded minus domestic quantity supplied.
Tariff Revenue
Government income from a tariff, equal to the tariff per unit times the number of imports.
Deadweight Loss From Trade Barriers
The lost total surplus caused when tariffs or quotas reduce mutually beneficial trades.
Opening To Trade
Domestic price moves to world price, changing surpluses and creating imports or exports.
Tariff
A tax on imports that raises domestic price, reduces imports, and creates government revenue.
Quota
A limit on imports that raises domestic price, reduces consumption, and increases domestic production.
Exports In A Competitive Market
The amount sold abroad, equal to domestic quantity supplied minus quantity demanded.
Notes
Autarky
A situation where a country does not trade internationally and relies only on domestic markets.
World Price
The price of a good on the international market, which domestic buyers and sellers take as given.
Imports in a Competitive Market
The amount bought from foreign producers, equal to domestic quantity demanded minus domestic quantity supplied.
Tariff Revenue
Government income from a tariff, equal to the tariff per unit times the number of imports.
Deadweight Loss From Trade Barriers
The lost total surplus caused when tariffs or quotas reduce mutually beneficial trades.
Opening To Trade
Domestic price moves to world price, changing surpluses and creating imports or exports.
Tariff
A tax on imports that raises domestic price, reduces imports, and creates government revenue.
Quota
A limit on imports that raises domestic price, reduces consumption, and increases domestic production.
Exports In A Competitive Market
The amount sold abroad, equal to domestic quantity supplied minus quantity demanded.
