Topic 2.2 Notes – Supply
1. What Supply Is and the Law of Supply
Supply is the quantity of a good or service that producers are willing and able to sell at various prices during a given time period.
- Willing → depends on profit.
- Able → depends on resources, technology, and production costs.
- On the graph: Price (P) on the y-axis, Quantity (Q) on the x-axis.
The Law of Supply
The Law of Supply says:
- As price increases, quantity supplied increases.
- As price decreases, quantity supplied decreases.
- This holds ceteris paribus (holding everything else constant).
Here’s what that looks like on a standard market supply graph:
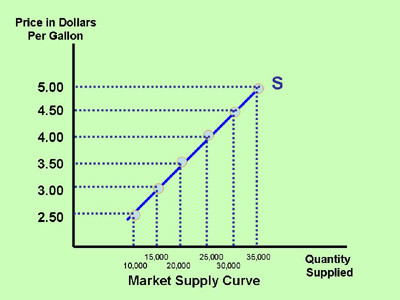
Upward-sloping market supply curve (S)
The curve labeled S slopes upward. At lower prices, firms supply smaller quantities. At higher prices, they supply larger quantities. Each point on the curve is a price-quantity pair.
Why the Curve Slopes Up
Two main reasons:
- Higher prices mean higher potential profit. Firms are more motivated to produce and sell more.
- Rising marginal cost. As firms produce additional units, costs typically rise. To cover those higher costs, they require higher prices.
You’ll connect this to marginal cost curves in later units, but even now remember: higher output usually costs more to produce at the margin.
2. Change in Quantity Supplied vs Change in Supply
This is one of the most tested distinctions on quizzes and the AP exam.
Change in Quantity Supplied
- Caused only by a change in the good’s own price.
- Shown as a movement along the supply curve.
- Price ↑ → move up the curve.
- Price ↓ → move down the curve.
The curve itself does not shift.
If the price of coffee rises from 4 dollars to 6 dollars, and producers sell more coffee, that is a movement along the curve.
Change in Supply
- Caused by something other than the good’s own price.
- Shown as a shift of the entire curve.
- Increase in supply → shift right.
- Decrease in supply → shift left.
- At every price, quantity supplied changes.
If you see a question that says “supply increases,” that always means the curve shifts right.
3. Determinants of Supply
These are the shifters. Know them cold.
1. Resource (Input) Costs
Examples: wages, steel, oil, rent.
- Input costs ↑ → production is less profitable → Supply decreases (left shift).
- Input costs ↓ → Supply increases (right shift).
Example: If oil prices spike, transportation and production costs rise, reducing supply for many goods.
2. Taxes and Subsidies
- Per-unit tax → raises cost of production → Supply decreases.
- Subsidy → lowers cost of production → Supply increases.
Real-world anchor: U.S. government subsidies for renewable energy have increased the supply of solar and wind power.
3. Technology and Productivity
Better technology lowers production costs.
- New machinery
- Automation
- Improved farming methods
When productivity rises, firms can produce more at every price → Supply increases.
The Industrial Revolution is a classic historical example of technology dramatically increasing supply.
4. Expectations
Producers think about the future.
- Expect higher future prices → hold inventory now → Current supply decreases.
- Expect lower future prices → sell more now → Current supply increases.
Oil markets often behave this way when producers anticipate geopolitical shocks.
5. Number of Sellers
- More firms enter → Market supply increases.
- Firms exit → Supply decreases.
Example: After cannabis legalization in several U.S. states, many new firms entered, shifting market supply right.
4. Market Supply and Why It Slopes Up
How Market Supply Is Derived
Market supply is the horizontal sum of all individual supply curves.
At each price:
- Add up how much Firm 1 supplies.
- Add how much Firm 2 supplies.
- Add all firms together.
That total is market quantity supplied.
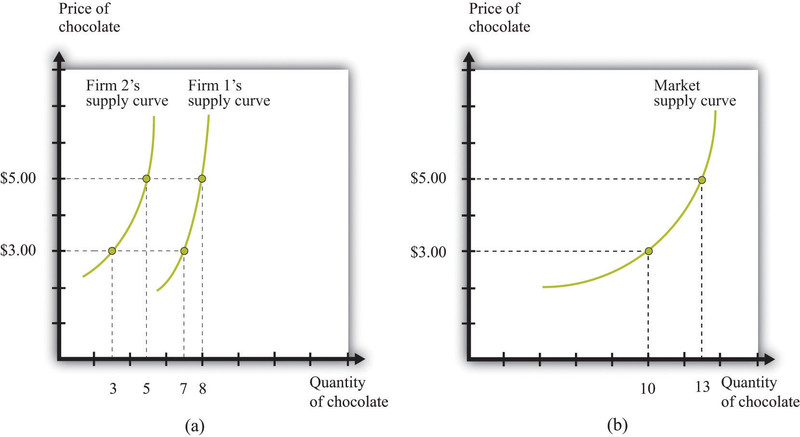
Individual supply curves added horizontally to form market supply
Why Market Supply Slopes Up
In the figure, the left panel shows two firms’ supply curves. At a price of 3 dollars, you add the two quantities to get the total market quantity. At 5 dollars, you do the same. The right panel plots those totals and connects them to form the market supply curve.
Two forces work together:
- Existing firms produce more as price rises (movement along their curves).
- New firms enter when prices are high enough to earn profit.
Higher price strengthens the profit incentive. More output follows.
Key Takeaways
Supply
The quantity producers are willing and able to sell at various prices over a period.
Law Of Supply
As price rises, quantity supplied rises; as price falls, quantity supplied falls.
Supply Curve
An upward-sloping graph showing the relationship between price and quantity supplied.
Quantity Supplied
The amount producers offer for sale at a specific price.
Market Supply
The total amount all producers in a market are willing and able to sell.
Market Supply Curve Derivation
Add individual quantities supplied horizontally at each price to get market supply.
Determinants Of Supply
Resource costs, taxes or subsidies, technology, expectations, and number of sellers.
Resource Costs
Higher input prices decrease supply, while lower input prices increase supply.
Taxes And Subsidies
Taxes decrease supply by raising costs; subsidies increase supply by lowering costs.
Technology And Productivity
Improved production methods increase output per resource unit and shift supply right.
Producer Expectations
Beliefs about future prices or conditions can increase or decrease current supply.
Number Of Sellers
More firms in a market increase supply; fewer firms decrease supply.
Change In Quantity Supplied Vs. Change In Supply
Price changes move along the curve; nonprice determinant changes shift the curve.
Supply Schedule
A table showing quantities producers will sell at different prices.
Notes
Supply
The quantity producers are willing and able to sell at various prices over a period.
Law Of Supply
As price rises, quantity supplied rises; as price falls, quantity supplied falls.
Supply Curve
An upward-sloping graph showing the relationship between price and quantity supplied.
Quantity Supplied
The amount producers offer for sale at a specific price.
Market Supply
The total amount all producers in a market are willing and able to sell.
Market Supply Curve Derivation
Add individual quantities supplied horizontally at each price to get market supply.
Determinants Of Supply
Resource costs, taxes or subsidies, technology, expectations, and number of sellers.
Resource Costs
Higher input prices decrease supply, while lower input prices increase supply.
Taxes And Subsidies
Taxes decrease supply by raising costs; subsidies increase supply by lowering costs.
Technology And Productivity
Improved production methods increase output per resource unit and shift supply right.
Producer Expectations
Beliefs about future prices or conditions can increase or decrease current supply.
Number Of Sellers
More firms in a market increase supply; fewer firms decrease supply.
Change In Quantity Supplied Vs. Change In Supply
Price changes move along the curve; nonprice determinant changes shift the curve.
Supply Schedule
A table showing quantities producers will sell at different prices.
