Topic 3.5 Notes – Profit Maximization
1. The Profit-Maximizing Rule
In theory of the firm, we assume firms exist to maximize profit.
Profit is
But firms do not maximize profit by staring at totals. They use marginal analysis, the same logic you’ve used all unit:
- Marginal Revenue (MR) = change in TR from selling one more unit
- Marginal Cost (MC) = change in TC from producing one more unit
A firm compares the benefit of one more unit (MR) to the cost of that unit (MC).
The Rule
✔️ Profit is maximized where MR = MC.
This rule holds in:
- Perfect competition
- Monopoly
- Monopolistic competition
- Oligopoly
Only the shape of MR changes across structures. The rule itself does not.
2. Why MR = MC Maximizes Profit
Think through the three possible cases.
Case 1: MR > MC
- The next unit adds more revenue than cost.
- Profit rises if the firm produces more.
- The firm should expand output.
Case 2: MR < MC
- The next unit costs more than it brings in.
- Profit falls if the firm produces more.
- The firm should cut back output.
Case 3: MR = MC
- The last unit adds exactly as much revenue as cost.
- There are no more profitable units left to produce.
- Profit is at its maximum.
This connects directly to the course’s big idea:
Rational decision-makers continue an activity as long as marginal benefit ≥ marginal cost.
For firms:
- Marginal benefit = MR
- Marginal cost = MC
A common mistake on quizzes is picking the output where total revenue is highest. That is not the same thing. Profit depends on both revenue and cost.
3. Finding the Profit-Maximizing Quantity from a Table
On an AP-style data table, you might be given TR, TC, MR, or MC.
Here’s the clean process:
- If MR and MC are given → find where MR = MC.
- If TR is given → calculate MR as the change in TR.
- If TC is given → calculate MC as the change in TC.
- Choose the last unit where MR ≥ MC before MC becomes larger.
Example pattern:
| Q | MR | MC |
|---|---|---|
| 1 | 12 | 5 |
| 2 | 10 | 7 |
| 3 | 8 | 8 |
| 4 | 6 | 10 |
Here, profit is maximized at Q = 3 because MR = MC.
If MR never equals MC exactly, choose the last unit where MR is still greater than or equal to MC.
4. Finding the Profit-Maximizing Quantity on a Graph
Marginal Revenue and Marginal Cost Graph
This is the most common AP visual. When you see downward-sloping demand and MR with an upward-sloping MC curve, you should immediately look for the MR = MC point.
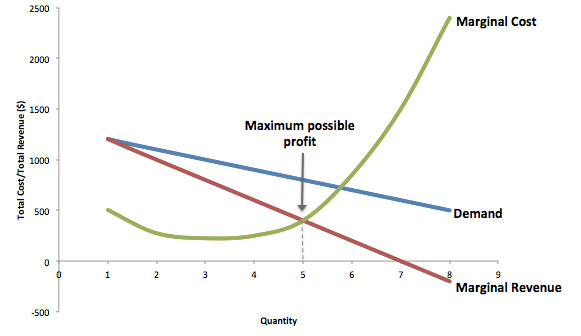
MR and MC determining profit-maximizing output
The firm produces at the intersection of MR and MC (shown by the dashed vertical line down to the quantity axis).
Important detail students miss:
- The firm does not produce where MC crosses demand.
- It produces where MC crosses MR.
In perfect competition, MR is horizontal (MR = price).
In monopoly, MR slopes downward.
Total Revenue and Total Cost Graph
You can also see the same rule using total curves. Profit is the vertical distance between TR and TC.
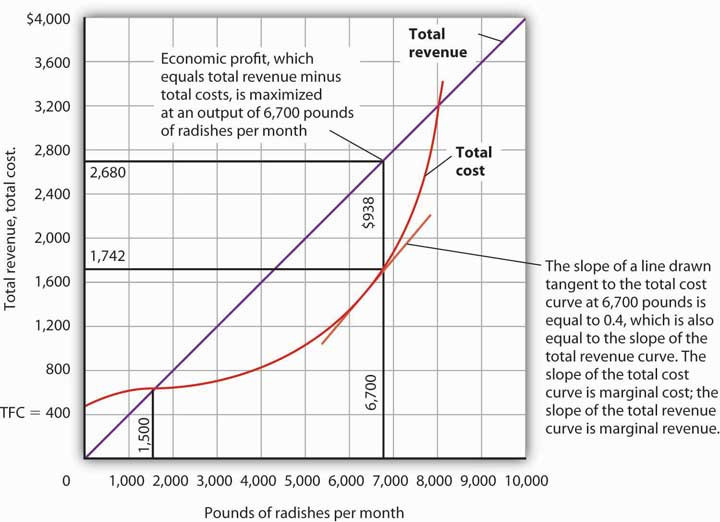
Total revenue and total cost at maximum profit
At the output where the vertical distance is greatest:
- Slope of TR = MR
- Slope of TC = MC
- Therefore MR = MC
That’s why the rule works.
5. After MR = MC
MR = MC gives you the profit-maximizing quantity, not the dollar profit.
To find profit:
- Go to the profit-maximizing quantity.
- Find the price (from demand or given data).
- Find ATC at that quantity.
- Calculate:
On a graph, profit is the rectangle between price and ATC at Q*.
Students often stop after finding Q*. On FRQs, that only earns partial credit. They usually want the profit area or value too.
Key Takeaways
Marginal Revenue and Marginal Cost Decision Rule
If MR > MC, increase output; if MR < MC, decrease output; if MR = MC, keep output unchanged.
Profit-Maximizing Rule
Produce the quantity where marginal cost equals marginal revenue and marginal cost is rising.
Notes
Marginal Revenue and Marginal Cost Decision Rule
If MR > MC, increase output; if MR < MC, decrease output; if MR = MC, keep output unchanged.
Profit-Maximizing Rule
Produce the quantity where marginal cost equals marginal revenue and marginal cost is rising.
