Topic 2.5 Notes – Other Elasticities
1. Elasticity Beyond Price
You already know price elasticity of demand. The structure is the same here:
Two new “other variables” matter:
- Income → Income elasticity of demand (YED)
- Price of another good → Cross-price elasticity of demand (XED)
The logic stays consistent:
- Use percent changes.
- Keep the negative sign when calculating YED and XED.
- The sign tells the relationship. The number tells the strength.
This fits the core idea of AP Micro: people respond to incentives. Income changes purchasing power. Other prices change relative attractiveness.
2. Income Elasticity of Demand
What It Measures
It shows how sensitive demand is to changes in consumer income.
Classifying Goods by YED
| Type of Good | YED Sign | What Happens When Income Rises? | Examples |
|---|---|---|---|
| Normal good | Positive | Demand increases | iPhones, new clothes, restaurant meals |
| Inferior good | Negative | Demand decreases | Ramen, bus tickets, thrift clothing |
| Sticky good | Zero | No change in demand | Very basic staples |
If income rises 8% and quantity demanded rises 4%:
Positive → normal good.
If income rises 10% and quantity demanded falls 5%:
Negative → inferior good.
Luxury vs. Necessity (within Normal Goods)
- Luxury:
Demand changes more than income. Think high-end vacations. - Necessity:
Demand changes less than income. Groceries, utilities.
During economic expansions, demand for luxury goods rises sharply. During recessions, inferior goods often see increased demand. You saw this during the Great Recession when discount retailers gained customers.
Fun fact: Giffen goods have upward-sloping demand curves, but they are not tested on AP Micro.
What Happens on a Graph?
Income changes shift demand. The graph below shows an increase in income for a normal good.
- Income ↑ for a normal good → Demand shifts right.
- Income ↑ for an inferior good → Demand shifts left.
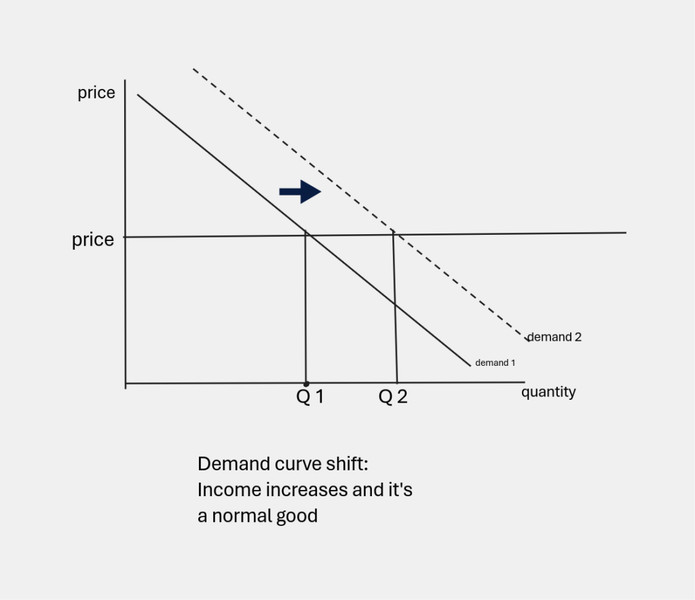
Rightward demand shift from an increase in income for a normal good
At the same price, quantity demanded increases from Q1 to Q2. That horizontal movement across quantities shows the outward shift of the entire demand curve, not a movement along the curve.
When demand shifts right at a given price, more units are sold and total revenue rises. When demand shifts left, fewer units are sold and total revenue falls. The change in TR here comes from the quantity shift, not from price elasticity of demand.
3. Cross-Price Elasticity of Demand
What It Measures
It tells you how goods are related.
Interpreting the Sign
| Relationship | XED Sign | What It Means | Examples |
|---|---|---|---|
| Substitutes | Positive | Price of B ↑ → Demand for A ↑ | Coke & Pepsi, Netflix & Disney+ |
| Complements | Negative | Price of B ↑ → Demand for A ↓ | Printers & ink, cars & gasoline |
| Unrelated | Zero | No relationship | Shoes & refrigerators |
If Pepsi’s price rises 6% and Coke’s quantity demanded rises 3%:
Positive → substitutes.
If gasoline rises 5% and SUV demand falls 4%:
Negative → complements.
What It Looks Like on a Graph
A price change in Good B causes a shift in demand for Good A.
- Substitutes → shift in same direction as the price change.
- Complements → shift in opposite direction.
In the graph below, coffee and tea are substitutes. When the price of coffee rises, the demand curve for tea shifts to the right, increasing quantity demanded at the same price from Q1 to Q2.
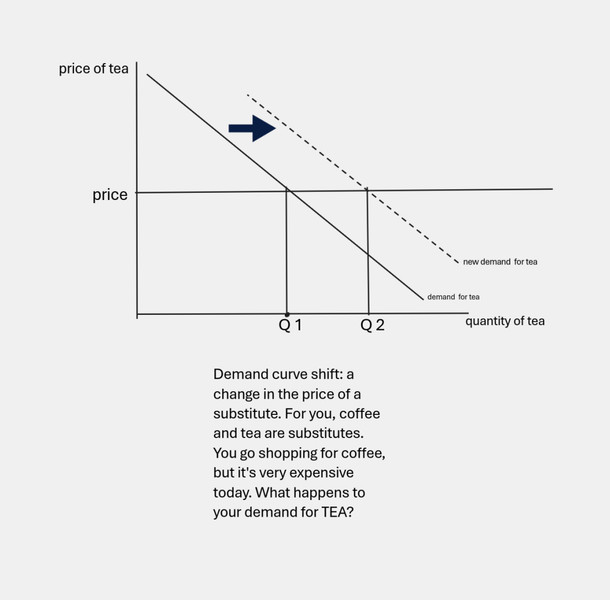
Rightward shift in demand for tea after a rise in the price of coffee
Firms use cross-price elasticity to:
- Predict competitor reactions.
- Define market boundaries in antitrust cases.
4. Calculating and Interpreting on Tests
When you see data:
- Compute percent change.
- Divide.
- Check the sign first.
- Then interpret magnitude.
Common mistakes:
- Dropping the negative sign.
- Mixing up which good goes in the numerator for XED.
- Saying “movement along demand” when it’s actually a shift.
- Confusing complements and substitutes. Always let the sign decide.
Key Takeaways
Other Elasticities
Measures responsiveness to changes in variables other than the good's own price.
Income Elasticity Of Demand
Percentage change in quantity demanded divided by percentage change in consumer income.
Zero Income Elasticity
A value of zero means income changes do not affect quantity demanded.
Cross-Price Elasticity Of Demand
Percentage change in quantity demanded of one good divided by percentage change in another good's price.
Normal And Inferior Goods
Demand rises with income for normal goods and falls with income for inferior goods.
Cross-Price Elasticity Relationships
Positive values mean substitutes, negative values mean complements, and zero means unrelated goods.
Notes
Other Elasticities
Measures responsiveness to changes in variables other than the good's own price.
Income Elasticity Of Demand
Percentage change in quantity demanded divided by percentage change in consumer income.
Zero Income Elasticity
A value of zero means income changes do not affect quantity demanded.
Cross-Price Elasticity Of Demand
Percentage change in quantity demanded of one good divided by percentage change in another good's price.
Normal And Inferior Goods
Demand rises with income for normal goods and falls with income for inferior goods.
Cross-Price Elasticity Relationships
Positive values mean substitutes, negative values mean complements, and zero means unrelated goods.
