Topic 2.3 Notes – Market Research
What Market Research Is and Why Businesses Use It
Market research means collecting detailed information about markets, products, and customer behavior to guide marketing decisions. The point is to replace guesses with evidence. It helps a lot, but it does not remove uncertainty.
A business usually begins with a decision or problem, not random data collection. The real question is something like, “Should we launch this?” or “Why are customers leaving?”
Businesses use market research to decide:
- Whether to pursue a market opportunity if the market looks attractive enough
- Which customers to target because not every customer is equally likely to buy
- What product or features to offer based on what customers value
- How to position the product meaning how to present it in a way that stands out
- How to retain or grow market share as customer needs and competition change
For new products, research checks three different things:
-
Desirability
Does the product create customer value? This is about problem-solution fit, meaning the product solves a real customer problem. -
Feasibility
Can the business actually make and deliver it with its resources, technology, expertise, and time? -
Viability
Can the product be profitable in the market?
Those three are easy to mix up, so keep them separate:
- A product can be desirable but not feasible.
- A product can be desirable but not viable.
- A product can be viable on paper but still not desirable to real customers.
For existing products, research helps businesses:
- detect changing customer needs and wants
- find dissatisfaction or why customers stop buying
- identify opportunities for innovation
- monitor competitors and substitutes
- retain or grow market share
Market share is the portion of total market sales earned by one business or product. It can be measured by revenue, units sold, or customers, but you have to stay consistent with the measure.
The Main Building Blocks of Research
Research usually follows a clear flow:
- Define the decision or problem
- State a research question or business hypothesis
- Review secondary-source information
- Choose primary research methods
- Identify the population and sample
- Collect quantitative and/or qualitative data
- Organize and visualize findings
- Interpret the evidence and its limits
- Decide whether to proceed, revise, research more, or stop
Quantitative and qualitative data
Quantitative data is numerical and measurable. It answers how many, how much, how often.
- market size
- survey percentages
- purchase rates
- market share
Qualitative data is descriptive and non-numerical, often in words or images. It answers why and how.
- interview comments
- focus group reactions
- observation notes
The strongest research often uses both. Quantitative data shows the pattern or scale. Qualitative data helps explain the reason behind it.
Business hypotheses
A business hypothesis is a specific assumption about a customer, product, or market.
A weak one is “Customers will like the product.”
That is too vague.
A stronger one is “Downtown office workers who buy takeout at least three times per week will choose a reusable-container option if return is convenient.”
A good hypothesis includes:
- the target customer
- the expected behavior or preference
- the relevant product or market condition
- the evidence needed to support or challenge it
Population and sample
The population is the full group the business wants to understand.
The sample is the smaller group actually studied.
Research gets skewed when:
- the sample is too small
- the wrong people are in the sample
- there is voluntary response bias
- questions are leading or loaded
- an experiment changes multiple variables at once
Secondary and Primary Research Methods
Businesses use both secondary-source and primary-source research.
Secondary-source research
This uses information that already exists from external sources. It is usually the starting point because it is more cost-effective.
Common sources include:
- government publications and databases
- commercial market reports
- academic journals and databases
- trade associations
- competitor websites, reports, product listings, and public filings
It helps assess:
- market size in dollars
- market size in total customers
- trends
- segments
- competitors
- factors influencing customer decisions
- PESTEL factors
political, economic, social, technological, environmental, legal
When reading secondary research, check:
- who produced it
- why it was produced
- when it was collected
- how the market was defined
- whether it matches the target population and geography
Primary-source research
This is new, first-hand evidence collected for the business’s own question.
The main methods line up with the kind of answer you need, whether that is quantitative data, qualitative insight, or behavior and cause-and-effect.
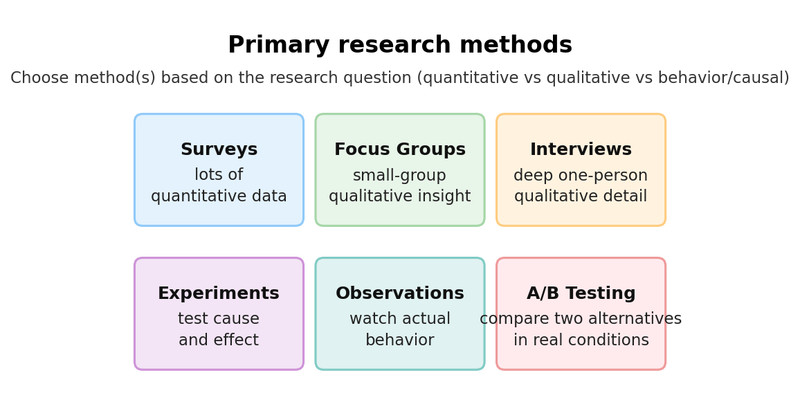
Primary research methods
- Surveys
Best for lots of quantitative data from a larger sample. Good for awareness, satisfaction, preferences, and intended behavior. - Focus groups
Small-group discussion for in-depth qualitative insights. Good for reactions, concerns, and follow-up discussion. - Interviews
One-on-one and deep. Good for motives, decision process, and sensitive topics. - Experiments
Change a condition and measure behavior. Best for testing cause and effect more directly. - Observations
Watch actual behavior in a natural setting. Good for what customers do, not just what they say. - A/B testing
A type of experiment comparing two viable alternatives in a real-world setting.
Example: compare the sign-up rate for Version A vs. Version B.
Choosing the method is pretty intuitive:
- need opinions from many people → survey
- need detailed explanations → focus group or interview
- need behavior data → observation or experiment
- need comparison of two alternatives → A/B test
How to Interpret Research and Avoid Bad Conclusions
The biggest mistake here is using a method that does not match the decision.
- Opinions are not behavior
- Interest is not purchase
- Blind preference is not brand loyalty
To reduce skew and bias:
- use sufficiently large samples
- make sure the sample reflects the real population
- ask neutral questions
- keep test conditions comparable
Research also has limits:
- findings may be limited, unclear, or contradictory
- customers may say one thing and do another
- markets and competitors can change quickly
New Coke
Coca-Cola did extensive research, including nearly 200,000 taste tests. In blind sip tests, many people preferred the sweeter formula. So Coca-Cola replaced the original with New Coke in 1985.
Customers reacted badly. The original formula returned as Coca-Cola Classic just 79 days later.
What this shows:
- lots of data does not guarantee a good decision
- research can answer the wrong question
- taste preference did not capture brand attachment, habit, identity, and reaction to losing the original
- findings must be interpreted, not obeyed automatically
Data Visualizations and What Each One Shows
Visuals make patterns easier to see and communicate. The chart should match the relationship you want to show.
- Bar chart
Best for comparing individual categories or data points, like several years of sales for one business or annual revenue for different businesses. - Stacked bar chart
Best for comparing totals and the subcategories inside them, like total sales per year plus product-line sales. - Line graph
Best for trends over time, like number of customers by year. - Pie chart
Best for part-to-whole at one point in time, like market share percentages.
When reading any visual, check:
- what is being measured
- the units used
- biggest and smallest values
- whether it shows a trend, comparison, or composition
- whether the visual actually supports the conclusion
- whether the scale is misleading, especially a truncated axis
Key Takeaways
Market Research
The process of collecting detailed information about markets, products, and customer behavior to guide marketing decisions
Quantitative Data
Numerical data that can be measured and analyzed, often answering how many, how much, or how often
Qualitative Data
Descriptive, non-numerical data recorded in words or images, often answering why or how
Desirability
The extent to which a product creates customer value by achieving problem-solution fit
Problem-Solution Fit
A product meaningfully addresses a problem, need, or want experienced by its intended customer
Feasibility
The business can produce and provide the product within its available resources, technology, expertise, and time
Viability
The product has the potential to be profitable in its market
Market Share
The portion of total market sales accounted for by a business or product, measured consistently by revenue, units, or customers
Secondary-Source Research
Gathering and interpreting quantitative or qualitative information already collected and published by external sources
Market Size
The total scale of a defined market, measured in sales dollars or total customers for a specified place, group, category, and time
Primary-Source Research
Research a business conducts to collect new, first-hand evidence for its particular question or hypothesis
Business Hypothesis
A specific, testable assumption about a customer, product, or market
Survey
A standardized set of questions given to a sample, usually to collect a large amount of quantitative data reflecting a population's views
Focus Group
A guided discussion with a small number of selected participants used to collect in-depth qualitative evidence
One-on-One Interview
An in-depth conversation between a researcher and one participant used to collect detailed qualitative evidence
Experiment
A research method that changes a condition and measures the resulting behavior, ideally while holding other important conditions constant
Observation
Watching and recording customer behavior in a natural environment without deliberately changing conditions
A/B Testing
An experiment that compares authentic customer responses to two viable alternatives that differ in the feature being tested
Population
The full group about which a business wants to draw a conclusion
Sample
The smaller group from which data is collected; it should be sufficiently large and appropriately populated to reflect the population
Skewed Data
Data distorted by a biased sample, question, procedure, or interpretation so it does not accurately reflect what is being studied
Unbiased Question
A question using neutral phrasing that does not lead respondents toward a favored answer or assume a view they may not hold
New Coke
The 1985 sweeter Coca-Cola reformulation favored in blind sip tests but rejected after replacing the original, showing that extensive research can test the wrong decision or miss brand attachment
Data Visualization
A visual display of data used to identify and communicate patterns, trends, and insights
Bar Chart
A chart using separate rectangular bars to compare individual data points or categories
Stacked Bar Chart
A chart whose bars compare totals while sections within each bar show the subcategories composing those totals
Line Graph
A graph connecting data points in chronological order to show the direction and pace of a trend over time
Pie Chart
A circular chart showing mutually exclusive parts of a whole, with all slices totaling 100 percent
Notes
Market Research
The process of collecting detailed information about markets, products, and customer behavior to guide marketing decisions
Quantitative Data
Numerical data that can be measured and analyzed, often answering how many, how much, or how often
Qualitative Data
Descriptive, non-numerical data recorded in words or images, often answering why or how
Desirability
The extent to which a product creates customer value by achieving problem-solution fit
Problem-Solution Fit
A product meaningfully addresses a problem, need, or want experienced by its intended customer
Feasibility
The business can produce and provide the product within its available resources, technology, expertise, and time
Viability
The product has the potential to be profitable in its market
Market Share
The portion of total market sales accounted for by a business or product, measured consistently by revenue, units, or customers
Secondary-Source Research
Gathering and interpreting quantitative or qualitative information already collected and published by external sources
Market Size
The total scale of a defined market, measured in sales dollars or total customers for a specified place, group, category, and time
Primary-Source Research
Research a business conducts to collect new, first-hand evidence for its particular question or hypothesis
Business Hypothesis
A specific, testable assumption about a customer, product, or market
Survey
A standardized set of questions given to a sample, usually to collect a large amount of quantitative data reflecting a population's views
Focus Group
A guided discussion with a small number of selected participants used to collect in-depth qualitative evidence
One-on-One Interview
An in-depth conversation between a researcher and one participant used to collect detailed qualitative evidence
Experiment
A research method that changes a condition and measures the resulting behavior, ideally while holding other important conditions constant
Observation
Watching and recording customer behavior in a natural environment without deliberately changing conditions
A/B Testing
An experiment that compares authentic customer responses to two viable alternatives that differ in the feature being tested
Population
The full group about which a business wants to draw a conclusion
Sample
The smaller group from which data is collected; it should be sufficiently large and appropriately populated to reflect the population
Skewed Data
Data distorted by a biased sample, question, procedure, or interpretation so it does not accurately reflect what is being studied
Unbiased Question
A question using neutral phrasing that does not lead respondents toward a favored answer or assume a view they may not hold
New Coke
The 1985 sweeter Coca-Cola reformulation favored in blind sip tests but rejected after replacing the original, showing that extensive research can test the wrong decision or miss brand attachment
Data Visualization
A visual display of data used to identify and communicate patterns, trends, and insights
Bar Chart
A chart using separate rectangular bars to compare individual data points or categories
Stacked Bar Chart
A chart whose bars compare totals while sections within each bar show the subcategories composing those totals
Line Graph
A graph connecting data points in chronological order to show the direction and pace of a trend over time
Pie Chart
A circular chart showing mutually exclusive parts of a whole, with all slices totaling 100 percent
