Topic 3.6 Notes – The Income Statement
What an Income Statement Shows
An income statement is a profit-and-loss statement for a period of time, such as a month, quarter, or year. It compares revenue with costs to show whether the business earned a net profit or had a net loss.
A couple reminders matter here because students mix these up a lot:
- This statement is a flow over time.
- A balance sheet is different. It is a snapshot at one date.
- An income statement tracks income and expenses, which is not the same thing as just tracking cash in and cash out.
Businesses often show multiple periods side by side so managers, owners, lenders, and investors can compare trends.
The big idea is the path from the top line to the bottom line. Each subtotal tells you something different about the business.
The Income Statement Formula Path
The statement follows one order every time:
Revenue
Revenue is income from the business’s core operations, like selling goods or services. It is the top line.
For projections, use:
The main cost categories
- COGS
- Direct costs of producing the goods sold.
- On this exam, treat COGS as a given or estimated total.
- You do not need detailed inventory accounting or gross-sales-to-net-sales adjustments.
- Operating expenses
- Indirect costs of running the business.
- Main groups:
- Selling expenses such as advertising and salespeople’s salaries
- General and administrative expenses such as office salaries, office rent, and insurance
- Research and development for creating or improving products or processes
- Interest expense
- Cost of borrowing money through loans or bonds
- Taxes
- Paid if pretax income is positive
Income statements may also identify nonrecurring expenses; detailed treatment of nonoperating items other than interest is outside AP scope.
The key profit measures
- Gross profit
- This shows how well the business manages pricing and direct costs.
- Operating profit
- Also equals revenue minus COGS minus operating expenses.
- This shows profit from operations before financing and taxes.
- Pretax income
- Net profit
- This is the bottom line and the income earned for owners during the period.
Common mistakes:
- Calling gross profit the final profit
- Forgetting to subtract COGS
- Putting interest or taxes inside operating expenses
Profit Margins and How to Read Performance
Dollar profit alone can fool you. A larger company will usually have larger dollar profits, so you need margins, which turn profit into a percentage of revenue.
The three margins
It helps to connect each margin to the part of the income statement it comes from.
- Shows success in pricing and managing direct costs
- Shows success in marketing, selling, administration, and controlling operating expenses
- Shows overall profitability
- Tells what percent of revenue flows to owners as income
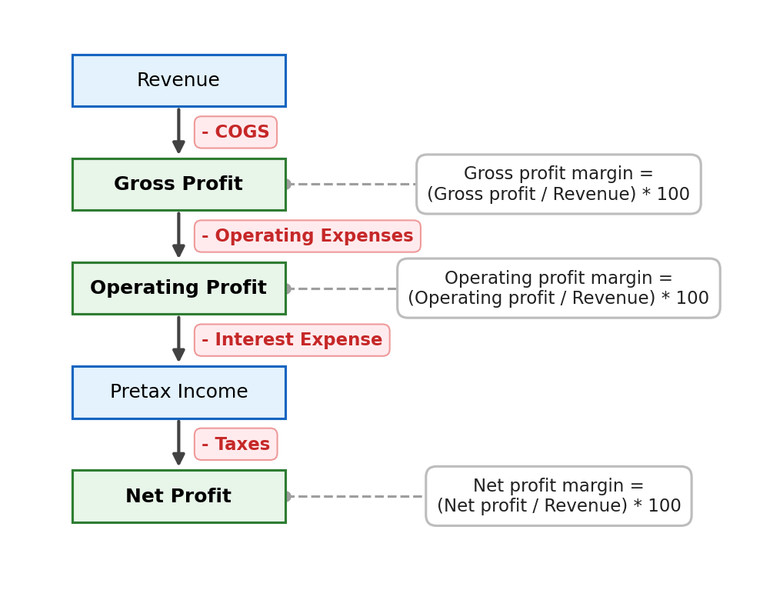
Profit flow and margin formulas
How to interpret changes
- If revenue rises but margins fall, sales grew but profitability weakened.
- If gross margin falls, check:
- prices
- supplier or input costs
- production efficiency
- waste
- product mix
- If gross margin stays steady but operating margin falls, check:
- advertising and marketing
- sales salaries
- office and admin costs
- R&D
- If operating margin is steady but net margin falls, check:
- interest expense
- taxes
Always compare margins with:
- Projections
- Past performance
- Competitors or industry norms
There is no universal “good” margin. It depends on the industry and business model.
Percentage change
You can use this for revenue, costs, profit, or margins.
One easy trap on tests:
- 42% to 40% is a drop of 2 percentage points
- It is also a percentage change of about
Those are not the same thing.
Hershey
Hershey is useful here because it shows how managers use revenue and cost data to spot financial challenges. Higher sales do not guarantee stronger profits. If ingredient, packaging, labor, transportation, or marketing costs rise too fast, margins get squeezed. Then managers might raise prices, cut costs, change product mix, or improve efficiency.
Projected Income Statements and Budgets
A projected income statement uses the same structure as a regular one, but with future estimates instead of past actual results.
Businesses estimate future revenue using:
- pricing strategy
- market research
- customer demand
- industry trends
- competition
- PESTEL forces
They estimate future COGS and operating expenses using:
- production plans
- supply chain costs
- occupancy costs
- marketing expenses
- office and sales salaries
- R&D
These projections help businesses:
- plan for expected costs
- estimate profit or loss
- identify funding needs
- maintain enough cash to meet current obligations
- compare actual results with the plan later
A business budget supports the projected income statement by estimating future revenues and expenses.
A consumer budget is different. It starts with expected net pay, which is income after taxes and other deductions, and allocates money to:
- savings
- expenses
- debt payments
- charitable donations
Consumer budgets help people track spending patterns and see whether they are meeting goals like saving for future expenses, managing debt, and donating to causes they support. Consumers also face financial uncertainty because income and expenses can change with changing needs and wants, competitive pressure within markets, and PESTEL forces, so thoughtful planning helps them meet financial goals.
How to Build or Analyze One Fast on a Test
If you are constructing an income statement:
- Write revenue
- Subtract COGS to get gross profit
- Subtract total operating expenses to get operating profit
- Subtract interest expense to get pretax income
- Subtract tax expense to get net profit
If you are evaluating performance:
- Check whether revenue, costs, and profit went up or down
- Calculate the three margins
- Compare with earlier periods, projections, and competitors
- Find where the weakness starts
- Match the recommendation to the cause
Keep the scope limits straight. You do not need detailed net sales adjustments, detailed COGS composition, nonoperating income and expenses other than interest, or below-the-bottom-line items.
Key Takeaways
Income Statement / Statement of Profit and Loss / Profit-and-Loss Statement
A financial statement comparing revenue with costs over a specified period to determine net profit or loss
Revenue / Total Revenue / Top Line
Income generated by a business’s core activities before costs are deducted
Cost of Goods Sold (COGS) / Cost of Sales
The direct costs associated with producing the goods sold or delivering services
Gross Profit
Profit after direct costs are deducted; gross profit = revenue − COGS.
Operating Expenses
Indirect costs of running a business, including selling, general and administrative, and research and development expenses
Selling Expenses
Operating expenses associated with marketing and selling products, such as advertising and salespeople’s salaries
General and Administrative Expenses
Operating expenses for administering the business, such as office salaries, office rent, insurance, supplies, and utilities
Research and Development Expense
Operating spending intended to create or improve products, services, or production processes
Operating Profit
Profit before interest and taxes; operating profit = gross profit − operating expenses
Interest Expense
The cost of borrowing money through loans, including bonds, but not repayment of loan principal
Pretax Income
Income before taxes; pretax income = operating profit − interest expense
Tax Expense
Taxes owed on positive pretax income and reported as an expense on the income statement
Nonrecurring Expense
An unusual or one-time expense identified separately so it is not mistaken for a normal recurring cost
Net Profit / Net Income / Income After Taxes / Bottom Line
The final profit earned for owners during the period; net profit = pretax income − taxes
Gross Profit Margin
Gross profit ÷ total revenue × 100; evaluates pricing and management of direct costs
Operating Profit Margin
Operating profit ÷ total revenue × 100; evaluates selling, administration, and control of operating expenses
Net Profit Margin
Net profit ÷ total revenue × 100; measures overall profitability and the percentage of revenue flowing to owners as income
Income-Statement Benchmarking
Comparing financial results with projections, past performance, and competitors or industry performance to assess whether expectations are being met
Percentage Change
Percent change = [(current value − initial value) ÷ initial value] × 100
Percentage-Point Change
The arithmetic difference between two percentages, unlike percentage change, which divides that difference by the initial percentage
Projected Income Statement
An income statement using estimated future revenues, costs, interest, and taxes to predict profit or loss for a future period
Business Budget
A financial plan estimating a business’s revenues and expenses and guiding spending for a future period
Consumer Budget
A plan allocating expected net pay among savings, expenses, debt payments, and other financial goals
Net Pay
Income remaining after taxes and other payroll deductions
Notes
Income Statement / Statement of Profit and Loss / Profit-and-Loss Statement
A financial statement comparing revenue with costs over a specified period to determine net profit or loss
Revenue / Total Revenue / Top Line
Income generated by a business’s core activities before costs are deducted
Cost of Goods Sold (COGS) / Cost of Sales
The direct costs associated with producing the goods sold or delivering services
Gross Profit
Profit after direct costs are deducted; gross profit = revenue − COGS.
Operating Expenses
Indirect costs of running a business, including selling, general and administrative, and research and development expenses
Selling Expenses
Operating expenses associated with marketing and selling products, such as advertising and salespeople’s salaries
General and Administrative Expenses
Operating expenses for administering the business, such as office salaries, office rent, insurance, supplies, and utilities
Research and Development Expense
Operating spending intended to create or improve products, services, or production processes
Operating Profit
Profit before interest and taxes; operating profit = gross profit − operating expenses
Interest Expense
The cost of borrowing money through loans, including bonds, but not repayment of loan principal
Pretax Income
Income before taxes; pretax income = operating profit − interest expense
Tax Expense
Taxes owed on positive pretax income and reported as an expense on the income statement
Nonrecurring Expense
An unusual or one-time expense identified separately so it is not mistaken for a normal recurring cost
Net Profit / Net Income / Income After Taxes / Bottom Line
The final profit earned for owners during the period; net profit = pretax income − taxes
Gross Profit Margin
Gross profit ÷ total revenue × 100; evaluates pricing and management of direct costs
Operating Profit Margin
Operating profit ÷ total revenue × 100; evaluates selling, administration, and control of operating expenses
Net Profit Margin
Net profit ÷ total revenue × 100; measures overall profitability and the percentage of revenue flowing to owners as income
Income-Statement Benchmarking
Comparing financial results with projections, past performance, and competitors or industry performance to assess whether expectations are being met
Percentage Change
Percent change = [(current value − initial value) ÷ initial value] × 100
Percentage-Point Change
The arithmetic difference between two percentages, unlike percentage change, which divides that difference by the initial percentage
Projected Income Statement
An income statement using estimated future revenues, costs, interest, and taxes to predict profit or loss for a future period
Business Budget
A financial plan estimating a business’s revenues and expenses and guiding spending for a future period
Consumer Budget
A plan allocating expected net pay among savings, expenses, debt payments, and other financial goals
Net Pay
Income remaining after taxes and other payroll deductions
