Topic 4.2 Notes – Evaluating Performance Using KPIs
What KPIs Are
A KPI is a data point managers choose to measure business performance. The important word is choose. Lots of numbers can be measured, but only the ones tied to an important goal count as KPIs.
Here’s the chain that holds the topic together:
- Mission = the business’s broad purpose
- Goals = the specific results it wants
- Strategy = the plan for getting those results
- KPIs = the evidence showing whether the plan is working
- Benchmarks = the standard used to judge the KPI
- Manager decision = continue, revise, or replace actions
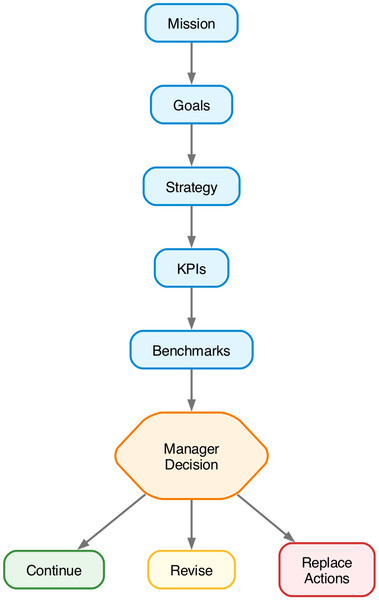
How KPIs connect goals, benchmarks, and manager decisions
This flow matters because a KPI is only useful when it links back to a goal and leads to a decision.
A KPI helps answer three questions at once:
- Are we making progress toward short-term and long-term goals?
- Is our strategy working?
- Are we staying profitable, competitive, and viable over time?
A common trap on tests is treating any number as a KPI. It only becomes a KPI if it connects to a meaningful goal. If a business cares about keeping paying customers, then social media follower count may matter less than customer retention, sales, or customer acquisition cost.
A useful KPI should clearly say:
- what is being measured
- how it is calculated
- the unit used
- the time period
- who or what is included
- the data source
- the benchmark used for comparison
KPIs can be:
- dollar amounts like revenue
- counts like number of customers
- percentages like retention rate
- rates like on-time delivery
- ratios like margin measures
One KPI never gives the whole story, so businesses usually track a set of financial, marketing and sales, and operations KPIs.
Types of KPIs
Financial-health KPIs
These tell you whether the business is making money, controlling costs, and keeping enough cash on hand.
- Revenue means money earned from sales.
- COGS means cost of goods sold. These are the direct costs tied to what was sold.
- Gross profit shows what is left after COGS.
Gross profit margin tells you how much of each sales dollar remains after direct costs. If gross margin is 40%, the business keeps of revenue after COGS, before operating expenses.
- Operating expenses are costs of running the business other than COGS, such as rent, salaries, marketing, and utilities.
- Cash flow tracks actual cash moving in and out.
This is one of the biggest test points in the topic. Profit is not the same as cash flow. A business can be profitable on paper and still have cash problems.
Marketing and sales KPIs
These show whether a business is gaining, keeping, and satisfying customers.
- Customer acquisition cost (CAC) tells you the average cost of getting one new customer.
- Customer lifetime value (CLV) estimates the value of a customer over the whole relationship.
CLV is usually interpreted alongside CAC. If CAC is too high compared with CLV, growth may not be sustainable.
Other common marketing and sales KPIs:
- Customer satisfaction ratings measured as an average score or percent meeting a standard
- Customer retention
- Total sales which could mean dollar sales, unit sales, or transactions, so always check the unit
- Market share
A classic mistake is assuming higher sales means higher market share. If the whole market grew faster, share could still fall.
Operations KPIs
These measure efficiency and reliability.
Lower cost is often good, but only if quality stays acceptable. A cheaper process that causes wrong orders or late deliveries may hurt the business overall.
Choosing the Right KPIs
There is no universal best KPI list. The right KPI depends on the business and industry.
- Subscription software often cares a lot about retention and CLV
- Restaurant might care about per-unit food cost, order accuracy, and customer satisfaction
- Delivery business often watches delivery cost and on-time delivery
- Manufacturer may watch unit cost, output, and defects
- Mission-driven fintech like BREAUX Capital needs both financial KPIs and mission-outcome KPIs
BREAUX Capital shows this clearly. Because it is mission-driven, managers would care about revenue and cash flow for financial viability, but also measures like active participation, retention, or customer outcomes that show whether the mission is actually being achieved.
Good KPI choices do three things:
- connect directly to the goal
- show whether performance is improving or worsening
- stay measured consistently over time
Bad comparisons usually come from mismatches:
- monthly vs annual data
- one store vs whole company
- dollar sales vs unit sales
- different customer definitions
- different definitions of “on time” or “retained”
Using Benchmarks to Evaluate Performance
A benchmark is the standard you compare a KPI to. The KPI is the number. The benchmark gives that number meaning.
Two main benchmark types:
- Internal historical benchmarks compare current performance to the business’s own past results
- External industry benchmarks compare performance to competitors or industry standards
A business can improve and still be below the industry standard. If operating margin rises from 7% to 10%, that is improvement. If the industry benchmark is 12%, the business still underperforms that outside standard.
One easy point to miss is percentage points versus percent change. This example shows the difference clearly:
- 88% to 92% = 4 percentage points
- relative increase
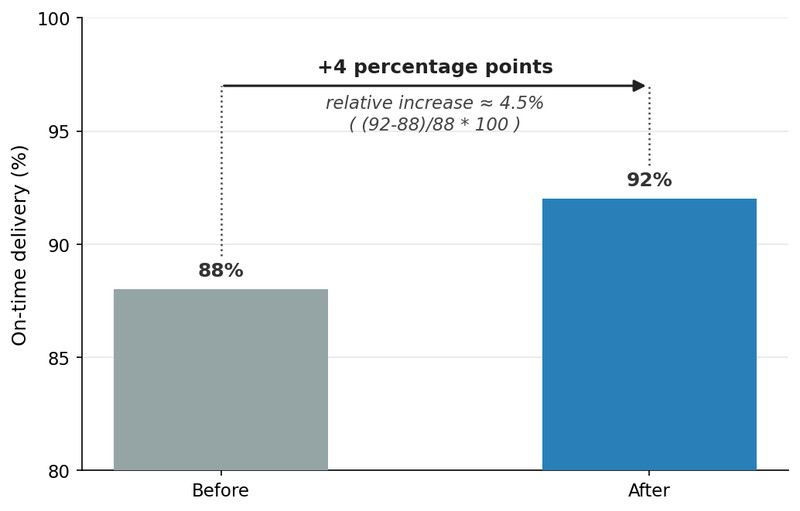
Direct differences between percentages are described in percentage points.
Benchmarks only work when they are comparable:
- same period
- same unit
- same market
- similar businesses
- same definitions and classifications
Interpreting KPI Results Together
A KPI tells you what changed. It does not automatically tell you why.
Usually favorable when these rise:
- revenue
- gross profit
- margins
- satisfaction
- retention
- market share
- order accuracy
- on-time delivery
Usually favorable when these fall:
- COGS
- operating expenses
- CAC
- per-unit cost
- delivery cost
But context matters:
- lower costs may hurt quality
- higher expenses may support future growth
- higher sales may come from discounts that shrink margins
- lower CAC may bring in weaker customers
The strongest exam-style evaluation uses three parts:
- State the KPI result
- Compare it to a benchmark
- Explain the business meaning
Example. A company might have positive operating profit, positive cash flow, and strong order accuracy, but weaker on-time delivery. That means the business may be financially solid overall, yet still have an operations problem that could hurt customer satisfaction.
Limits matter too:
- poor KPI choice can mislead managers
- one period may be seasonal or temporary
- combined data can hide weak spots
- KPI data may show correlation, not causation
- improving one KPI may hurt another
Key Takeaways
Key Performance Indicator (KPI)
A data point selected to measure business performance, progress toward goals, or a strategy’s effectiveness
Revenue (Sales Revenue)
Amount earned from selling goods or services during a period; revenue = units sold × selling price per unit
Cost of Goods Sold (COGS)
Direct cost associated with the goods or services sold during a period
Gross Profit
Revenue remaining after COGS is deducted; gross profit = revenue − COGS.
Gross Profit Margin
Percentage of revenue remaining after COGS; gross profit margin = gross profit ÷ revenue × 100
Operating Expenses
Costs of running the business that are not classified as COGS, such as rent, marketing, utilities, and administrative salaries
Operating Profit
Profit from normal operations; operating profit = revenue − COGS − operating expenses, or gross profit − operating expenses
Operating Profit Margin
Percentage of revenue remaining as operating profit; operating profit margin = operating profit ÷ revenue × 100
Cash Flow
Cash moving into and out of a business during a period, which differs from accounting profit
Net Cash Flow
The difference between cash inflows and outflows; net cash flow = cash inflows − cash outflows
Customer Acquisition Cost (CAC)
Average cost of gaining a new customer; CAC = customer-acquisition spending ÷ new customers acquired for the same period
Customer Lifetime Value (CLV)
Estimated value generated over a customer relationship; basic revenue-based CLV = average purchase amount × purchases per period × customer lifespan
Customer Satisfaction Rating
A summary of customers’ evaluations of a product, service, or interaction, reported on a defined scale or as a percentage
Customer Retention
Ability to keep existing customers; retention rate = (ending customers − new customers acquired) ÷ starting customers × 100
Total Sales
The total units sold, sales transactions, or sales revenue during a stated period, with the unit identified
Market Share
A business’s portion of sales in a defined market; market share = business sales ÷ total market sales × 100
Per-Unit Cost (Unit Cost)
Average relevant cost for each unit; per-unit cost = total relevant cost ÷ number of units
Delivery Cost
Cost of delivering orders, reported as a total or as average delivery cost = total delivery cost ÷ number of deliveries
Order Accuracy Rate
Percentage of orders completed without error; order accuracy rate = accurate orders ÷ total orders × 100
Percentage of Deliveries Received on Time (On-Time Delivery Rate)
Percentage of deliveries arriving by the consistently defined promised time; rate = on-time deliveries ÷ total deliveries × 100
Benchmark
A reference point used to compare KPI data with a standard and assess performance
Internal Historical Benchmark
A performance standard based on the same business’s data from an earlier month, quarter, year, or other period
External Industry Benchmark
A performance standard based on results typical of comparable businesses or the relevant industry
Percentage-Point Change
The direct difference between two percentages; percentage-point change = new percentage − old percentage
Notes
Key Performance Indicator (KPI)
A data point selected to measure business performance, progress toward goals, or a strategy’s effectiveness
Revenue (Sales Revenue)
Amount earned from selling goods or services during a period; revenue = units sold × selling price per unit
Cost of Goods Sold (COGS)
Direct cost associated with the goods or services sold during a period
Gross Profit
Revenue remaining after COGS is deducted; gross profit = revenue − COGS.
Gross Profit Margin
Percentage of revenue remaining after COGS; gross profit margin = gross profit ÷ revenue × 100
Operating Expenses
Costs of running the business that are not classified as COGS, such as rent, marketing, utilities, and administrative salaries
Operating Profit
Profit from normal operations; operating profit = revenue − COGS − operating expenses, or gross profit − operating expenses
Operating Profit Margin
Percentage of revenue remaining as operating profit; operating profit margin = operating profit ÷ revenue × 100
Cash Flow
Cash moving into and out of a business during a period, which differs from accounting profit
Net Cash Flow
The difference between cash inflows and outflows; net cash flow = cash inflows − cash outflows
Customer Acquisition Cost (CAC)
Average cost of gaining a new customer; CAC = customer-acquisition spending ÷ new customers acquired for the same period
Customer Lifetime Value (CLV)
Estimated value generated over a customer relationship; basic revenue-based CLV = average purchase amount × purchases per period × customer lifespan
Customer Satisfaction Rating
A summary of customers’ evaluations of a product, service, or interaction, reported on a defined scale or as a percentage
Customer Retention
Ability to keep existing customers; retention rate = (ending customers − new customers acquired) ÷ starting customers × 100
Total Sales
The total units sold, sales transactions, or sales revenue during a stated period, with the unit identified
Market Share
A business’s portion of sales in a defined market; market share = business sales ÷ total market sales × 100
Per-Unit Cost (Unit Cost)
Average relevant cost for each unit; per-unit cost = total relevant cost ÷ number of units
Delivery Cost
Cost of delivering orders, reported as a total or as average delivery cost = total delivery cost ÷ number of deliveries
Order Accuracy Rate
Percentage of orders completed without error; order accuracy rate = accurate orders ÷ total orders × 100
Percentage of Deliveries Received on Time (On-Time Delivery Rate)
Percentage of deliveries arriving by the consistently defined promised time; rate = on-time deliveries ÷ total deliveries × 100
Benchmark
A reference point used to compare KPI data with a standard and assess performance
Internal Historical Benchmark
A performance standard based on the same business’s data from an earlier month, quarter, year, or other period
External Industry Benchmark
A performance standard based on results typical of comparable businesses or the relevant industry
Percentage-Point Change
The direct difference between two percentages; percentage-point change = new percentage − old percentage
