Topic 1.5 Notes – Supply
1. What Supply Is
Supply is the different quantities of a good or service that producers are willing and able to sell at various prices over a given time period.
Two words matter:
- Willing → Firms want to produce it.
- Able → They have the resources and technology to produce it.
In a competitive market (many buyers and sellers, no single firm controls price), supply combines with demand to determine the equilibrium price.
Quantity Supplied vs. Supply
This distinction shows up constantly on quizzes.
- Quantity supplied = one specific amount at one specific price (a single point).
- Supply = the entire relationship between price and quantity (the whole curve).
If the price of coffee is 4 dollars and firms produce 1,000 cups, that 1,000 is quantity supplied. The whole curve showing all possible price-quantity combinations is supply.
If only the good’s own price changes → movement along the curve.
If anything else changes → the curve shifts.
2. The Law of Supply
The law of supply says there is a positive (direct) relationship between price and quantity supplied.
- Price ↑ → Quantity supplied ↑
- Price ↓ → Quantity supplied ↓
That creates an upward-sloping supply curve.
Here’s what that looks like on a standard graph of price and quantity:
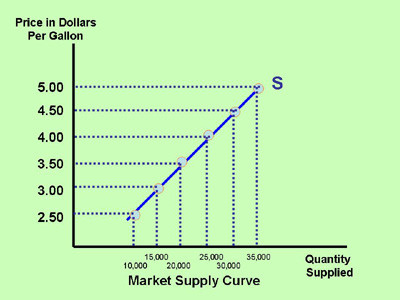
Upward-sloping market supply curve
Why the Curve Slopes Upward
As you move up along the curve from lower prices to higher prices, the quantity supplied increases. Three main reasons explain why:
- Profit incentive
Higher prices mean higher potential profit, so firms produce more. - Increasing opportunity cost
To produce more, firms must use resources that are less efficient or more expensive. - Entry of new firms
High prices make production attractive, so new producers enter the market.
During the early COVID-19 pandemic, high prices for items like hand sanitizer and masks encouraged firms to ramp up production. That’s the law of supply in action.
Movements Along the Curve
If the price of wheat rises from 5 dollars to 7 dollars, farmers supply more wheat. That’s an increase in quantity supplied, shown as a movement upward along the supply curve. The curve itself does not move.
The only thing that changes quantity supplied is the good’s own price. The AP exam loves testing that sentence.
3. Determinants of Supply
These factors shift the entire supply curve. A helpful acronym is ROTTEN.
R - Resource Prices (Input Costs)
Examples: wages, oil, steel, rent.
- Input costs ↑ → production becomes more expensive → supply decreases (shift left).
- Input costs ↓ → cheaper to produce → supply increases (shift right).
When oil prices spike, airlines face higher costs and reduce supply of flights.
O - Other Good Prices
Two cases:
- Substitutes in production
If soybean prices rise, farmers may switch from corn to soybeans → corn supply decreases. - Complements in production
If beef production rises, leather supply may also rise since it’s a byproduct.
T - Taxes (and Subsidies)
- Taxes increase → costs increase → supply decreases.
- Subsidies increase → costs decrease → supply increases.
Government farm subsidies increase agricultural supply. A new excise tax on cigarettes decreases cigarette supply.
T - Technology
Better technology lowers costs.
- Automation in factories
- Improved farming equipment
- Faster production methods
Technology ↑ → supply shifts right.
E - Expectations
If producers expect prices to rise in the future, they ramp up production now → current supply increases.
If they expect prices to fall, they cut back production → current supply decreases.
N - Number of Sellers
More firms in the market → supply increases.
Firms exit the market → supply decreases.
When craft breweries expanded across the U.S., beer supply increased.
4. Supply Shifts vs. Movements Along the Curve
This is one of the most tested distinctions.
| Situation | Cause | What Changes | Graph Result |
|---|---|---|---|
| Movement along curve | Change in the good’s own price | Quantity supplied | Stay on same curve |
| Shift of curve | Change in ROTTEN factor | Supply | Entire curve shifts left or right |
If wages increase for restaurant workers, that is not a movement. It’s a leftward shift of supply because production costs changed.
When answering FRQs, be precise:
- Say “increase in quantity supplied” for price changes.
- Say “increase in supply” for determinant changes.
Key Takeaways
Law of Supply
As price rises, quantity supplied rises; as price falls, quantity supplied falls.
Supply Curve
An upward-sloping graph showing the positive relationship between price and quantity supplied.
Determinants of Supply
Nonprice factors that shift supply: resources, other good prices, taxes, technology, expectations, and sellers.
Resources / Input Prices
Lower input costs increase supply; higher input costs decrease supply.
Other Good Prices
If alternative products become more profitable, producers shift resources away, reducing current supply.
Taxes and Government Regulation
Higher production taxes or stricter rules decrease supply; lower taxes or fewer rules increase it.
Technology
Better production methods increase supply by lowering costs or raising productivity.
Producer Expectations
Beliefs about future prices or profits can increase or decrease current supply.
Number of Sellers
More firms in a market increase supply; fewer firms decrease supply.
Supply vs. Quantity Supplied
The whole curve shows all amounts offered at different prices, while one point shows a specific price amount.
Change in Quantity Supplied vs. Change in Supply
Price changes move along the curve, while nonprice factors shift the entire curve.
Notes
Law of Supply
As price rises, quantity supplied rises; as price falls, quantity supplied falls.
Supply Curve
An upward-sloping graph showing the positive relationship between price and quantity supplied.
Determinants of Supply
Nonprice factors that shift supply: resources, other good prices, taxes, technology, expectations, and sellers.
Resources / Input Prices
Lower input costs increase supply; higher input costs decrease supply.
Other Good Prices
If alternative products become more profitable, producers shift resources away, reducing current supply.
Taxes and Government Regulation
Higher production taxes or stricter rules decrease supply; lower taxes or fewer rules increase it.
Technology
Better production methods increase supply by lowering costs or raising productivity.
Producer Expectations
Beliefs about future prices or profits can increase or decrease current supply.
Number of Sellers
More firms in a market increase supply; fewer firms decrease supply.
Supply vs. Quantity Supplied
The whole curve shows all amounts offered at different prices, while one point shows a specific price amount.
Change in Quantity Supplied vs. Change in Supply
Price changes move along the curve, while nonprice factors shift the entire curve.
