Topic 5.6 Notes – Economic Growth
1. Economic Growth Measured by Real GDP per Capita
Economic growth = sustained increase in real GDP per capita.
- Real GDP removes inflation.
- Per capita adjusts for population size.
- If real GDP rises 4% but population rises 5%, real GDP per capita falls → standard of living declines.
This is why China can have a huge total GDP but still lower per capita GDP than the United States. Total output is not the same as output per person.
Growth Rate Formula
Quick example:
Real GDP per capita rises from 40,000 to 42,000.
Be ready to:
- Compute per capita GDP from data.
- Compare growth rates across countries.
- Identify which country’s standard of living is rising faster.
Long-run prosperity depends on sustained increases in output per person, not just temporary expansions.
2. The Aggregate Production Function and Productivity
The aggregate production function (APF) shows the relationship between inputs (especially labor) and total output.
Holding other inputs constant:
- More labor → more output.
- This explains why aggregate employment and aggregate output move together.
Average Labor Productivity
Average labor productivity = output per worker.
Higher productivity → higher real GDP per capita.
According to the APF, productivity depends on:
1. Physical Capital per Worker
- Machinery, factories, infrastructure, tools.
- More or better capital → workers produce more.
- Investment spending builds capital stock.
2. Human Capital per Worker
- Education, job training, skills, health.
- Examples:
- College education
- Workforce training programs
- Vaccinations that keep workers healthy
- The GI Bill after WWII expanded college access and boosted U.S. growth.
3. Technology
- Knowledge and innovation that improve production.
- Examples:
- Eli Whitney’s cotton gin (huge jump in productivity)
- The internet and automation
- Modern AI and medical technology
- Government supports tech through R&D funding, research grants, and patents.
4. Natural Resources
- Land, oil, minerals, timber.
- Canada benefits from abundant natural resources.
- Renewable vs. nonrenewable resources matter for sustainability.
- Environmental protection may reduce short-run output but supports long-run productivity.
Core relationship you must lock in:
More physical capital per worker + more human capital per worker + better technology
→ higher productivity
→ higher real GDP per capita.
3. How Growth Appears on Graphs
Growth always shows up as an increase in full-employment output.
Production Possibilities Curve
- PPC shows maximum output at full employment.
- Outward shift = economic growth.
- Causes: more resources, better tech, more capital, more education.
Long-Run Aggregate Supply
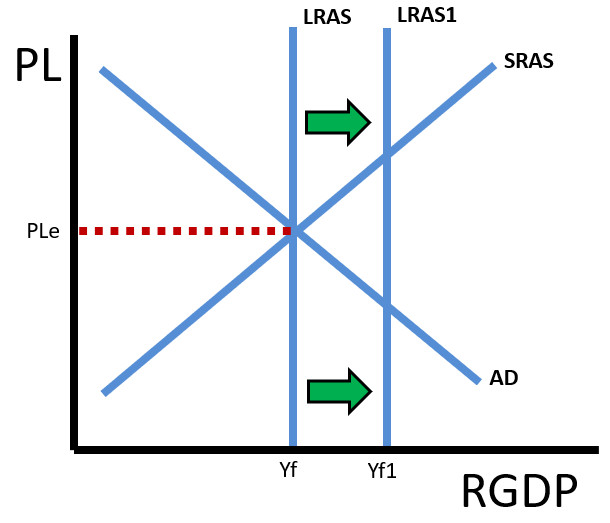
Rightward shift of the long-run aggregate supply curve
- LRAS represents potential GDP.
- Rightward shift of LRAS = economic growth.
In the AD-AS model, this shows up as LRAS moving from Yf to Yf1, increasing real GDP at full employment.
These shifts are analogous:
- Outward PPC shift = rightward LRAS shift.
- Both mean the economy can produce more at full employment.
If a question says “increase in human capital,” you should immediately think PPC outward and LRAS right. Do not shift AD. That’s short-run fluctuation.
4. Saving, Investment, and Policies That Promote Growth
Growth requires investment, and investment requires saving.
Households save → banks lend → firms invest in:
- Physical capital
- Education and training (human capital)
Growth-Promoting Policies
- Encourage saving
- Tax breaks on interest income
- Retirement incentives
- Encourage investment
- Investment tax credits
- Lower corporate taxes
- Support education
- Public education funding
- Student loan subsidies
- Job training programs
- Fund research
- Government R&D grants
- Patent protections
If a policy removes an investment tax credit, long-run growth slows. If it increases education funding or research grants, growth rises.
5. Long-Run Growth vs Short-Run Fluctuations
Business cycles are short-run AD shifts.
Economic growth is a long-run LRAS shift.
After WWII, U.S. growth was driven by education expansion, capital investment, and technological progress. East Asian “Tiger” economies grew rapidly through high saving and heavy human capital investment.
Even small differences in growth rates compound dramatically over decades.
Growth = higher productivity → higher real GDP per capita → outward PPC + rightward LRAS.
Key Takeaways
Real GDP Per Capita
Real GDP divided by population, used to compare average output per person.
Long-Run Aggregate Supply (LRAS)
The economy's full-employment output when all resources are fully used.
Production Possibilities Curve (PPC) and LRAS Relationship
An outward PPC shift matches a rightward LRAS shift because both show higher full-employment output.
Aggregate Production Function
A model showing how inputs like labor and capital determine total output.
Aggregate Employment and Aggregate Output
They are directly related because more workers produce more output, other things equal.
Average Labor Productivity
Output per employed worker.
Productivity Determinants
Technology, physical capital per worker, and human capital per worker determine output per worker.
Technology
Knowledge and innovation that let workers produce more output with the same resources.
Physical Capital
Human-made tools, equipment, and structures used to produce goods and services.
Human Capital
Workers' education, skills, training, and health that increase productivity.
Output Per Capita and Capital Per Capita
Output per person rises as physical capital per person and human capital per person increase.
Saving and Investment
More saving finances more investment in capital, supporting long-run economic growth.
Economic Growth
An increase in real GDP per capita over time, measured by its percent change.
Notes
Real GDP Per Capita
Real GDP divided by population, used to compare average output per person.
Long-Run Aggregate Supply (LRAS)
The economy's full-employment output when all resources are fully used.
Production Possibilities Curve (PPC) and LRAS Relationship
An outward PPC shift matches a rightward LRAS shift because both show higher full-employment output.
Aggregate Production Function
A model showing how inputs like labor and capital determine total output.
Aggregate Employment and Aggregate Output
They are directly related because more workers produce more output, other things equal.
Average Labor Productivity
Output per employed worker.
Productivity Determinants
Technology, physical capital per worker, and human capital per worker determine output per worker.
Technology
Knowledge and innovation that let workers produce more output with the same resources.
Physical Capital
Human-made tools, equipment, and structures used to produce goods and services.
Human Capital
Workers' education, skills, training, and health that increase productivity.
Output Per Capita and Capital Per Capita
Output per person rises as physical capital per person and human capital per person increase.
Saving and Investment
More saving finances more investment in capital, supporting long-run economic growth.
Economic Growth
An increase in real GDP per capita over time, measured by its percent change.
