Topic 1.4 Notes – Demand
1. What Demand Is and What the Demand Curve Shows
Demand is the different quantities of a good or service that consumers are willing and able to buy at various prices over a given time period.
- Willing = they want it.
- Able = they have the purchasing power to pay for it.
Demand is shown with a downward-sloping curve.
A typical demand curve looks like this:
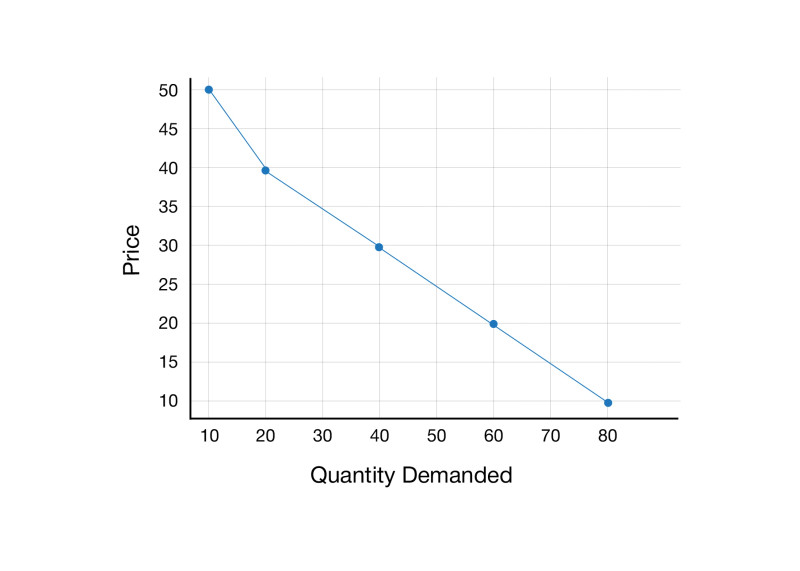
Downward-sloping demand curve
- Price is on the y-axis.
- Quantity demanded is on the x-axis.
- Each point on the curve shows one price-quantity combination.
The Law of Demand
The law of demand says there is an inverse relationship between price and quantity demanded.
- If price increases, quantity demanded decreases.
- If price decreases, quantity demanded increases.
That inverse relationship is why the curve slopes downward from left to right.
Why does it slope down?
Two key reasons:
- Substitution effect
When a good becomes more expensive, consumers switch to relatively cheaper alternatives.
Example: If beef prices rise, people buy more chicken. - Income effect
When price falls, your purchasing power increases. You can afford more with the same income.
Lower gas prices leave households with extra money to spend.
This relationship is the foundation of competitive markets. Later, you’ll combine demand with supply to determine equilibrium price and quantity.
2. Demand vs. Quantity Demanded
This is one of the most common AP mistakes. The test loves to hide this in wording.
Quantity Demanded
- A single point on the demand curve
- The amount bought at one specific price
- Changes only when the good’s own price changes
- Shown as a movement along the curve
Look at the demand curve below. Points A, B, and C are all on the same curve.
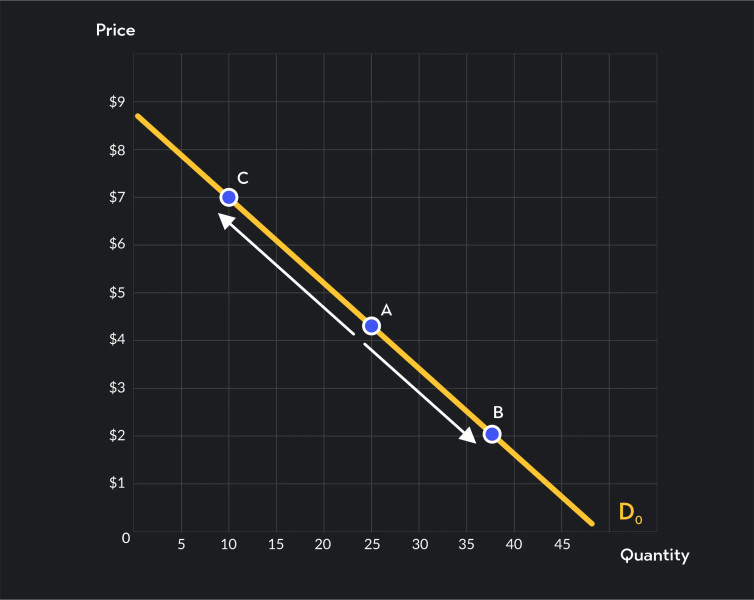
Movement along a single demand curve (D₀)
Moving from point C to point B is a change in quantity demanded. The curve itself does not move. Only the price changes.
If price rises, you move up the curve.
If price falls, you move down the curve.
Only price changes quantity demanded. Nothing else.
Demand
- The entire curve
- Shows all possible price-quantity combinations
- Changes when a non-price determinant changes
- Shown as a shift of the curve
Right shift = increase in demand
Left shift = decrease in demand
If a question mentions income, population, or prices of related goods, you are dealing with a shift, not a movement.
3. Determinants of Demand
These factors shift the whole curve. Use INSECT.
- I = Income
- N = Number of buyers
- S = Substitutes
- E = Expectations
- C = Complements
- T = Tastes and preferences
A shift means that at every price, quantity demanded changes.
Income
It depends on the type of good:
- Normal good: income ↑ → demand ↑
Example: During economic expansions, demand for vacations rises. - Inferior good: income ↑ → demand ↓
Example: During the Great Depression, many households shifted toward cheaper staple goods because incomes fell.
Know this distinction cold. The AP likes to test inferior goods.
Number of Buyers
- More consumers → demand increases
- Fewer consumers → demand decreases
Population growth, immigration, or new market access all raise demand. Think about housing demand in growing cities.
Substitutes
Goods used in place of one another.
- Price of substitute ↑ → demand for this good ↑
- Price of substitute ↓ → demand for this good ↓
If coffee prices rise, demand for tea increases.
Complements
Goods consumed together. They have joint demand.
- Price of complement ↑ → demand for this good ↓
- Price of complement ↓ → demand for this good ↑
If gas prices increase, demand for SUVs falls.
Expectations
- Expect higher future price → demand now increases
- Expect lower future price → demand now decreases
If people expect home prices to rise next year, they buy now.
Tastes and Preferences
- Positive change (advertising, trends, health info) → demand increases
- Negative publicity → demand decreases
Think about how health awareness increased demand for plant-based foods.
Key Takeaways
Demand
The quantities consumers are willing and able to buy at various prices.
Quantity Demanded
The amount consumers are willing and able to buy at a specific price.
Law of Demand
As price rises, quantity demanded falls; as price falls, quantity demanded rises.
Demand Curve
A downward-sloping graph showing quantities demanded at different price levels.
Change In Quantity Demanded
A movement along the same curve caused only by a change in the good's price.
Income and Demand
Higher consumer income usually increases demand, while lower income usually decreases demand.
Number of Buyers and Demand
More consumers increase market demand; fewer consumers decrease market demand.
Substitutes and Demand
If a substitute's price rises, demand increases; if it falls, demand decreases.
Complements and Demand
If a complement's price falls, demand increases; if it rises, demand decreases.
Expectations of Future Price and Demand
Expected higher future prices raise current demand; expected lower future prices reduce current demand.
Tastes and Preferences and Demand
Greater consumer preference increases demand, while weaker preference decreases demand.
Determinants of Demand
Nonprice factors like income, buyers, substitutes, expectations, complements, and tastes shift demand.
Change In Demand
A leftward or rightward shift of the demand curve caused by a nonprice factor.
Notes
Demand
The quantities consumers are willing and able to buy at various prices.
Quantity Demanded
The amount consumers are willing and able to buy at a specific price.
Law of Demand
As price rises, quantity demanded falls; as price falls, quantity demanded rises.
Demand Curve
A downward-sloping graph showing quantities demanded at different price levels.
Change In Quantity Demanded
A movement along the same curve caused only by a change in the good's price.
Income and Demand
Higher consumer income usually increases demand, while lower income usually decreases demand.
Number of Buyers and Demand
More consumers increase market demand; fewer consumers decrease market demand.
Substitutes and Demand
If a substitute's price rises, demand increases; if it falls, demand decreases.
Complements and Demand
If a complement's price falls, demand increases; if it rises, demand decreases.
Expectations of Future Price and Demand
Expected higher future prices raise current demand; expected lower future prices reduce current demand.
Tastes and Preferences and Demand
Greater consumer preference increases demand, while weaker preference decreases demand.
Determinants of Demand
Nonprice factors like income, buyers, substitutes, expectations, complements, and tastes shift demand.
Change In Demand
A leftward or rightward shift of the demand curve caused by a nonprice factor.
