Topic 4.5 Notes – The Money Market
1. The Money Market
The money market shows how the nominal interest rate is determined by the interaction of money demand (MD) and money supply (MS).
In the graph below, the downward-sloping MD curve intersects the vertical MS curve to determine the equilibrium nominal interest rate and quantity of money.
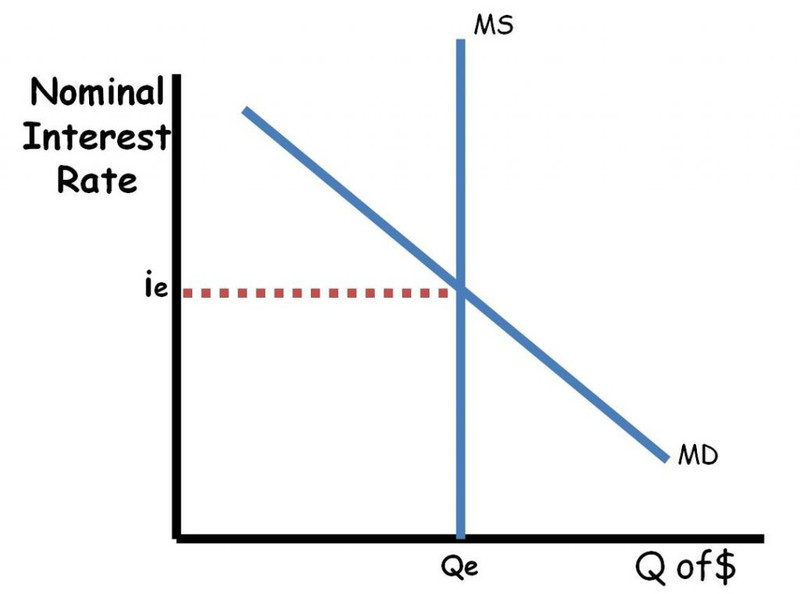
Money market equilibrium
- Vertical axis → Nominal interest rate
- Horizontal axis → Quantity of money
- Equilibrium → where
Quick reminder:
This is different from the loanable funds market, which focuses on saving and borrowing. The money market is about how much wealth people want to hold in liquid form.
2. Money Demand
Money demand shows an inverse relationship between the nominal interest rate and the quantity of money demanded.

Money demand curve (MD)
Why it slopes downward
The key idea is opportunity cost.
- Holding money means you’re not holding interest-earning assets like bonds.
- The nominal interest rate is the opportunity cost of holding money.
As you move up the curve in the graph, the interest rate is higher and the quantity of money demanded is lower. As you move down the curve, the interest rate is lower and the quantity demanded is higher.
So:
- High interest rates → holding money is costly → quantity demanded falls
- Low interest rates → holding money is less costly → quantity demanded rises
This is exactly what AP questions test. If rates rise, you move up the curve (not a shift).
What shifts Money Demand
These shift the entire curve:
- Price Level
- Higher price level → more money needed for transactions → MD shifts right.
- Lower price level → MD shifts left.
- Real GDP (Income)
- Economic expansion → more transactions → MD shifts right.
- Recession → fewer transactions → MD shifts left.
- Transaction Costs / Payment Technology
- ATMs, credit cards, Venmo → people hold less cash → MD shifts left.
- Higher transaction costs → MD shifts right.
If something increases the need for transactions, money demand shifts right.
3. Money Supply
Money supply (MS) is set by the Federal Reserve and is independent of the nominal interest rate.
That’s why it’s drawn as a vertical line in the money market graph.
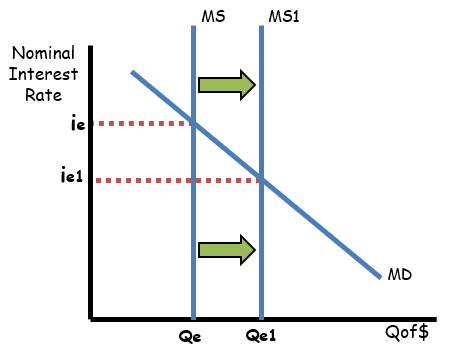
Money market with an increase in money supply
Notice how the supply curve is vertical at MS. When the Fed increases the money supply, the curve shifts right to MS1.
The Fed controls the monetary base, so at any interest rate, the quantity of money supplied is fixed until policy changes.
Fed tools
- Open Market Operations
- Buy bonds → MS increases
- Sell bonds → MS decreases
- Discount Rate
- Reserve Requirement
- Federal Funds Rate targeting
Historical anchors you should know:
- Paul Volcker (early 1980s) → restricted money growth to fight inflation → higher interest rates.
- 2008 Financial Crisis → massive MS increase through quantitative easing.
- COVID-19 response (2020) → large expansion of MS to stabilize the economy.
Only the Fed shifts MS. If the question says “monetary policy,” think MS shift.
4. Money Market Equilibrium and Interest Rate Adjustment
Equilibrium
Equilibrium occurs when the nominal interest rate makes quantity demanded = quantity supplied.
That interest rate influences bond prices and investment decisions.
Disequilibrium Adjustment
If the interest rate is above equilibrium:
- Quantity of money demanded < quantity supplied → surplus of money.
- People use excess money to buy bonds.
- Bond prices rise.
- Interest rates fall.
- Market moves back to equilibrium.
If the interest rate is below equilibrium:
- Quantity demanded > quantity supplied → shortage of money.
- People sell bonds to get cash.
- Bond prices fall.
- Interest rates rise.
- Market returns to equilibrium.
Bond prices and interest rates always move in opposite directions. That relationship shows up constantly in MCQs.
5. How Shifts Change the Nominal Interest Rate
Increase in Money Demand (MD → right)
- Interest rate rises
- Example: higher real GDP during expansion
Decrease in Money Demand (MD → left)
- Interest rate falls
- Example: recession
Increase in Money Supply (MS → right)
- Interest rate falls
- Expansionary (easy) monetary policy
- Seen in 2008 and 2020
Decrease in Money Supply (MS → left)
- Interest rate rises
- Contractionary (tight) policy
- Example: Volcker anti-inflation policy
When explaining on a test, always show:
- Which curve shifts
- Direction of interest rate change
- Surplus/shortage logic if asked
Key Takeaways
Money Market
The market where money demand and money supply determine the nominal interest rate.
Money Demand
The quantity of money people want to hold at different nominal interest rates.
Money Supply
The total quantity of money available, set by the central bank and independent of interest rates.
Nominal Interest Rate
The stated interest rate, equal to the real interest rate plus expected inflation.
Inverse Relationship Between Nominal Interest Rate and Money Demanded
As the nominal interest rate rises, the quantity of money demanded falls, and vice versa.
Opportunity Cost of Holding Money
The interest income forgone by holding wealth as money instead of interest-bearing assets.
Vertical Money Supply Curve
A money supply graph showing the quantity of money is unchanged at all nominal interest rates.
Money Market Graphing Conventions
Nominal interest rate is on the vertical axis and quantity of money on the horizontal axis.
Money Market Equilibrium
The market clears at the nominal interest rate where money demanded equals money supplied.
Money Market Disequilibrium and Interest Rate Adjustment
Money shortages raise nominal interest rates, while surpluses lower them toward equilibrium.
Shifters of Money Demand
Price level, real GDP, and transaction costs shift the quantity of money people want to hold.
Monetary Policy and Money Supply
Central bank actions shift money supply right to lower rates or left to raise rates.
Notes
Money Market
The market where money demand and money supply determine the nominal interest rate.
Money Demand
The quantity of money people want to hold at different nominal interest rates.
Money Supply
The total quantity of money available, set by the central bank and independent of interest rates.
Nominal Interest Rate
The stated interest rate, equal to the real interest rate plus expected inflation.
Inverse Relationship Between Nominal Interest Rate and Money Demanded
As the nominal interest rate rises, the quantity of money demanded falls, and vice versa.
Opportunity Cost of Holding Money
The interest income forgone by holding wealth as money instead of interest-bearing assets.
Vertical Money Supply Curve
A money supply graph showing the quantity of money is unchanged at all nominal interest rates.
Money Market Graphing Conventions
Nominal interest rate is on the vertical axis and quantity of money on the horizontal axis.
Money Market Equilibrium
The market clears at the nominal interest rate where money demanded equals money supplied.
Money Market Disequilibrium and Interest Rate Adjustment
Money shortages raise nominal interest rates, while surpluses lower them toward equilibrium.
Shifters of Money Demand
Price level, real GDP, and transaction costs shift the quantity of money people want to hold.
Monetary Policy and Money Supply
Central bank actions shift money supply right to lower rates or left to raise rates.
