Topic 4.7 Notes – The Loanable Funds Market
1. The Loanable Funds Market
The loanable funds market shows how savers (suppliers of funds) and borrowers (demanders of funds) determine the real interest rate (r).
- Real interest rate = nominal interest rate adjusted for inflation
- It’s the price of borrowing money in real terms.
Here’s the standard graph you should picture automatically when thinking about this market:
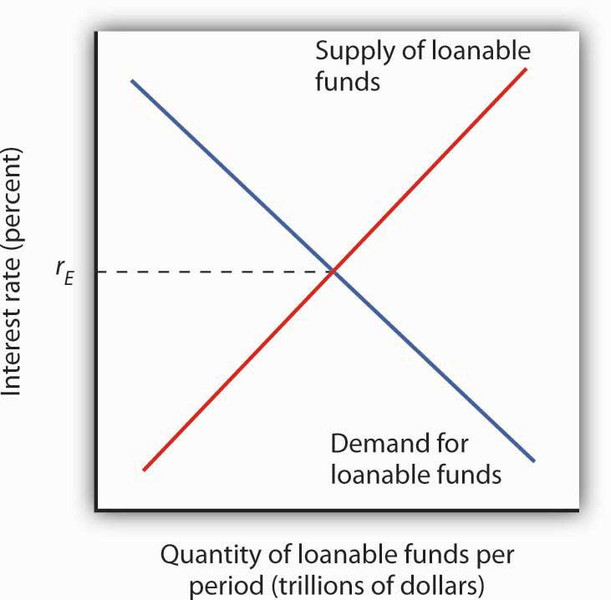
Loanable funds market equilibrium
- Y-axis = real interest rate
- X-axis = quantity of loanable funds
- Demand for loanable funds slopes downward
- Supply of loanable funds slopes upward
The equilibrium real interest rate (often labeled on graphs like this) is where quantity demanded equals quantity supplied.
This model links directly to something you already know:
- Saving = source of funds
- Investment = use of funds
- In a closed economy: S = I
The real interest rate moves until the amount people want to borrow equals the amount people want to save.
2. Demand and Supply of Loanable Funds
Demand for Loanable Funds
Demand comes from:
- Businesses (investment spending on factories, equipment)
- Households (homes, cars)
- Government (budget deficits)
The relationship is inverse:
- Higher → borrowing is more expensive → quantity demanded falls
- Lower → borrowing is cheaper → quantity demanded rises
Shifters of Demand
- Government budget deficits
- More deficit spending → government borrows more → D shifts right
- This is what happened after the 2008 financial crisis and during COVID-19 stimulus spending.
- Business expectations
- Optimism about future profits → more investment → D right
- Recession fears → D left
- Investment incentives
- Investment tax credit → encourages firms to borrow → D right
When the federal government ran large deficits in the 1980s under Reagan, many economists argued this increased demand for funds and pushed up real interest rates.
Supply of Loanable Funds
Supply comes from:
- Household saving
- Business saving
- Foreign investors
- Banks lending reserves
The relationship is positive:
- Higher → saving is more rewarding → quantity supplied rises
- Lower → saving is less attractive → quantity supplied falls
Shifters of Supply
- Savings behavior
- Higher saving rate → S right
- More consumption → S left
- Government budget position
- Budget surplus → increases public saving → S right
- Budget deficit → reduces public saving → S left
- Foreign capital inflows
- Foreigners buying U.S. bonds → S right
- The U.S. often receives large capital inflows because Treasury bonds are seen as safe.
- Expectations
- Fear of recession → households save more → S right
- Expected inflation → people pull money from banks → S left
- Federal Reserve discount rate
- Lower discount rate → banks borrow more reserves → S right
- Higher discount rate → S left
Be careful: the discount rate affects the supply of loanable funds, not demand.
3. National Saving in Closed and Open Economies
Closed Economy
No international borrowing or lending.
- Private saving = income − taxes − consumption
- Public saving = taxes − government spending
If the government runs a budget deficit, public saving is negative.
In a closed economy:
All saving becomes domestic investment.
Open Economy
Countries can borrow or lend internationally.
- Net capital inflow = foreign money invested domestically
- If domestic saving is low but investment is high, the country borrows from abroad.
The U.S. often runs budget deficits and still maintains strong investment because of foreign purchases of U.S. assets.
4. Equilibrium and Interest Rate Adjustment
Equilibrium
Equilibrium occurs where:
- Quantity demanded = quantity supplied
- This determines equilibrium real interest rate and quantity .
Disequilibrium Adjustment
If is above equilibrium:
- Quantity supplied > quantity demanded
- Surplus of funds
- Lenders compete → falls
If is below equilibrium:
- Quantity demanded > quantity supplied
- Shortage of funds
- Borrowers compete → rises
The market pushes the real interest rate back to equilibrium automatically.
Effects of Shifts
- Demand ↑ → ↑, Q ↑
- Demand ↓ → ↓, Q ↓
- Supply ↑ → ↓, Q ↑
- Supply ↓ → ↑, Q ↓
Large government deficits can increase demand, raise real interest rates, and reduce private investment. That reduction in private investment is called crowding out, and it shows up constantly in FRQs.
Key Takeaways
Loanable Funds Market
The market where savers supply funds and borrowers demand funds, determining the real interest rate.
Demand for Loanable Funds
The amount borrowers want to borrow at each real interest rate, with an inverse relationship.
Supply of Loanable Funds
The amount savers and lenders provide at each real interest rate, with a positive relationship.
Equilibrium in the Loanable Funds Market
The point where quantity of funds demanded equals quantity supplied at the market real interest rate.
Shortage and Surplus in the Loanable Funds Market
Below equilibrium, quantity demanded exceeds quantity supplied; above equilibrium, quantity supplied exceeds quantity demanded.
Effects of a Demand Shift in the Loanable Funds Market
Demand right raises real interest rates and quantity; demand left lowers real interest rates and quantity.
Effects of a Supply Shift in the Loanable Funds Market
Supply right lowers real interest rates and raises quantity; supply left raises real interest rates and lowers quantity.
National Saving
The sum of private and public saving; in open economies, investment equals saving plus net capital inflow.
Determinants of Loanable Funds Demand and Supply
Government borrowing, investment incentives, and saving behavior shift demand or supply of loanable funds.
Notes
Loanable Funds Market
The market where savers supply funds and borrowers demand funds, determining the real interest rate.
Demand for Loanable Funds
The amount borrowers want to borrow at each real interest rate, with an inverse relationship.
Supply of Loanable Funds
The amount savers and lenders provide at each real interest rate, with a positive relationship.
Equilibrium in the Loanable Funds Market
The point where quantity of funds demanded equals quantity supplied at the market real interest rate.
Shortage and Surplus in the Loanable Funds Market
Below equilibrium, quantity demanded exceeds quantity supplied; above equilibrium, quantity supplied exceeds quantity demanded.
Effects of a Demand Shift in the Loanable Funds Market
Demand right raises real interest rates and quantity; demand left lowers real interest rates and quantity.
Effects of a Supply Shift in the Loanable Funds Market
Supply right lowers real interest rates and raises quantity; supply left raises real interest rates and lowers quantity.
National Saving
The sum of private and public saving; in open economies, investment equals saving plus net capital inflow.
Determinants of Loanable Funds Demand and Supply
Government borrowing, investment incentives, and saving behavior shift demand or supply of loanable funds.
