Topic 1.6 Notes – Market Equilibrium, Disequilibrium, and Changes in Equilibrium
1. Market Equilibrium
In a competitive market, equilibrium occurs where quantity demanded (Qd) equals quantity supplied (Qs).
That point is the intersection of the demand and supply curves, like the point where the upward-sloping supply curve and downward-sloping demand curve cross in the graph below.
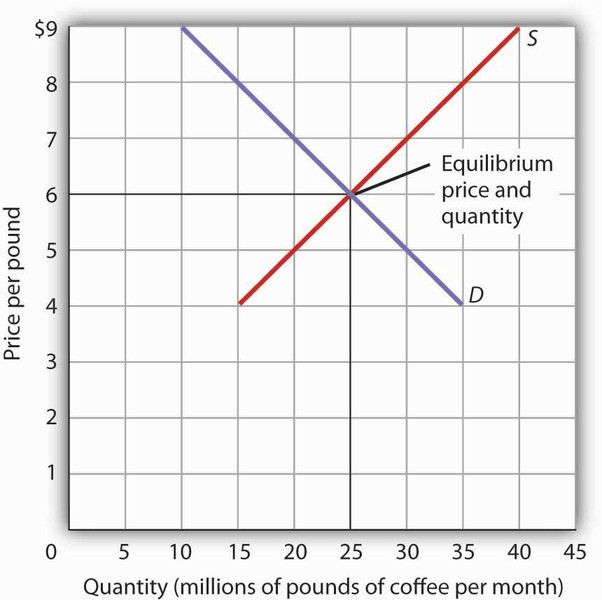
Supply and demand at market equilibrium
At equilibrium:
- Equilibrium price (Pe) is the market-clearing price.
- Equilibrium quantity (Qe) is the amount bought and sold.
- There is no pressure for price to rise or fall.
- All buyers willing and able to pay Pe can purchase.
- All sellers willing and able to sell at Pe can sell.
Why this matters:
- It results from voluntary exchange.
- It maximizes total surplus
- Consumer surplus = benefit to buyers
- Producer surplus = benefit to sellers
- It is allocatively efficient in a competitive market.
Quick reminder:
- Demand slopes downward due to the law of demand.
- Supply slopes upward due to the law of supply.
- The intersection is always your anchor on MCQs and FRQs.
2. Disequilibrium Surpluses and Shortages
When price is not at equilibrium, Qd ≠ Qs. That’s disequilibrium.
Shortage
A shortage occurs when:
- Caused by a price below equilibrium
- Also called excess demand
On a graph:
- Price is set below Pe.
- Qd is larger than Qs.
- Shortage amount = Qd − Qs
Example calculation:
If at 5 dollars, Qd = 80 and Qs = 50 → shortage = 30 units.
What happens next:
- Buyers compete.
- Some offer higher prices.
- Price rises.
- As price rises:
- Qd decreases (movement along demand)
- Qs increases (movement along supply)
The market self-corrects toward Pe.
Real-world anchor:
Gasoline price ceilings in the 1970s during the energy crisis led to long lines and shortages because prices were held below equilibrium.
Surplus
A surplus occurs when:
- Caused by a price above equilibrium
- Also called excess supply
On a graph:
- Price is above Pe.
- Qs exceeds Qd.
- Surplus amount = Qs − Qd
Example calculation:
If at 12 dollars, Qs = 120 and Qd = 90 → surplus = 30 units.
What happens next:
- Unsold goods pile up.
- Sellers lower prices.
- Price falls.
- As price falls:
- Qd increases
- Qs decreases
The market again moves back to equilibrium.
Real-world anchor:
Agricultural price floors in the U.S., such as wheat supports, created persistent surpluses the government had to purchase and store.
The Core Adjustment Rule
- Shortage → price rises
- Surplus → price falls
- Price changes cause movement along curves, not shifts.
That distinction shows up constantly on tests.
3. How Shifts Create a New Equilibrium
If a determinant of demand or supply changes, the whole curve shifts. That creates a new intersection, new Pe, new Qe.
Four possible single shifts:
| Change | What Shifts | Effect on Pe | Effect on Qe | Example |
|---|---|---|---|---|
| Increase in Demand | D → right | ↑ | ↑ | Higher income for a normal good |
| Decrease in Demand | D → left | ↓ | ↓ | Consumers prefer substitutes |
| Increase in Supply | S → right | ↓ | ↑ | Technological improvement |
| Decrease in Supply | S → left | ↑ | ↓ | Higher input costs |
Pattern to memorize:
- Demand shifts → price and quantity move in the same direction
- Supply shifts → price and quantity move in opposite directions
That shortcut saves time on MCQs.
4. When Both Demand and Supply Shift
Sometimes both curves move.
What you can usually say with certainty:
- If both increase → quantity increases
- If both decrease → quantity decreases
Price may be indeterminate. It depends on which shift is larger.
Example:
- Strong economic growth increases demand.
- New technology increases supply.
- Quantity definitely rises.
- Price depends on relative size of shifts.
On FRQs, if price is unclear, write that it is indeterminate. Guessing loses points.
Key Takeaways
Market Disequilibrium
A market condition where quantity demanded and quantity supplied are unequal.
Surplus
A condition where quantity supplied exceeds quantity demanded at a given price.
Shortage
A condition where quantity demanded exceeds quantity supplied at a given price.
Price Adjustment Toward Equilibrium
Surpluses push price down, while shortages push price up until quantities are equal.
Calculating Surplus or Shortage
Subtract the smaller quantity from the larger at the disequilibrium price.
Changes in Equilibrium from Demand and Supply Shifts
Demand or supply shifts create a new equilibrium price and quantity.
Increase in Demand
Raises equilibrium price and equilibrium quantity, assuming supply is unchanged.
Decrease in Demand
Lowers equilibrium price and equilibrium quantity, assuming supply is unchanged.
Increase in Supply
Lowers equilibrium price and raises equilibrium quantity, assuming demand is unchanged.
Decrease in Supply
Raises equilibrium price and lowers equilibrium quantity, assuming demand is unchanged.
Market Equilibrium
The market-clearing point where quantity demanded equals quantity supplied at one price.
Notes
Market Disequilibrium
A market condition where quantity demanded and quantity supplied are unequal.
Surplus
A condition where quantity supplied exceeds quantity demanded at a given price.
Shortage
A condition where quantity demanded exceeds quantity supplied at a given price.
Price Adjustment Toward Equilibrium
Surpluses push price down, while shortages push price up until quantities are equal.
Calculating Surplus or Shortage
Subtract the smaller quantity from the larger at the disequilibrium price.
Changes in Equilibrium from Demand and Supply Shifts
Demand or supply shifts create a new equilibrium price and quantity.
Increase in Demand
Raises equilibrium price and equilibrium quantity, assuming supply is unchanged.
Decrease in Demand
Lowers equilibrium price and equilibrium quantity, assuming supply is unchanged.
Increase in Supply
Lowers equilibrium price and raises equilibrium quantity, assuming demand is unchanged.
Decrease in Supply
Raises equilibrium price and lowers equilibrium quantity, assuming demand is unchanged.
Market Equilibrium
The market-clearing point where quantity demanded equals quantity supplied at one price.
