Topic 4.2 Notes – Change in Momentum and Impulse
Momentum and What It Means
Linear momentum measures how hard something is to stop.
- Vector quantity → same direction as velocity
- Units: (also )
- Depends on both mass and velocity
- A slow truck can have more momentum than a fast tennis ball.
Change in Momentum
For constant mass,
The direction of matches the direction of the net external force.
If velocity reverses direction, the momentum change is large because the vector flips sign. That’s why bouncing off a wall produces a big force.
Big idea: forces don’t directly change velocity. They change momentum over time.
Net Force and Rate of Change of Momentum
The most fundamental relationship here is:
Net external force equals the rate at which momentum changes.
- Larger force → momentum changes faster
- Zero net force → momentum stays constant
- Works separately in x and y components
If mass is constant:
So comes directly from the momentum idea. Momentum is the more general version. On FRQs, stating that “the net external force equals the rate of change of momentum” is often stronger than jumping straight to .
Boundary note: You are not required to analyze systems where mass changes over time.
The Impulse-Momentum Theorem
Impulse tells you the total “push” delivered over time.
Impulse is a vector:
- Same direction as the net force
- Units:
The key theorem:
Impulse equals the change in momentum.
This works even if the force changes during the interaction.
If a 0.20 kg cart slows from to :
So the impulse is . The negative sign tells you the force was opposite the initial motion.
Impulse and Force-Time Graphs
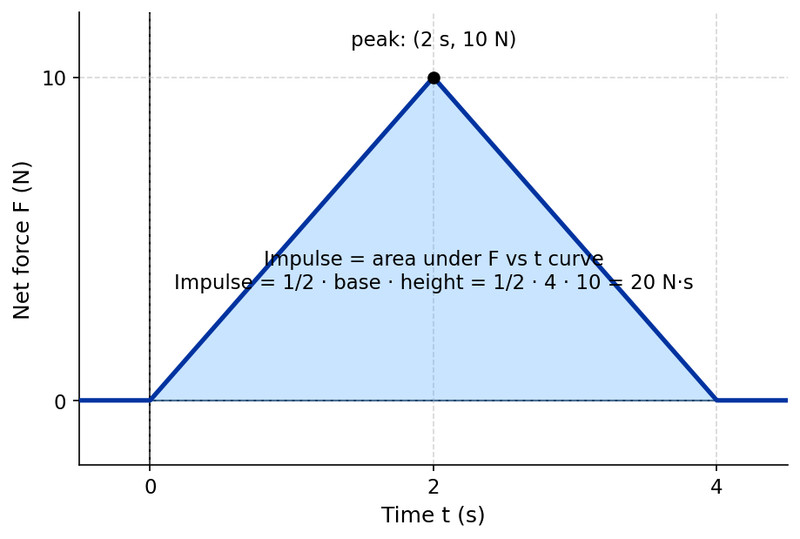
Impulse equals the area under a net force vs. time graph.
In the example below, the force increases to a peak of 10 N at 2 s and then decreases back to zero at 4 s. The shaded triangular region represents the impulse.
Force vs. time graph with triangular impulse
- Rectangle →
- Triangle →
- Curved shape → total area under curve
- Below axis → negative impulse
- Net impulse = total signed area
This shows up a lot in multiple choice. If the graph has positive and negative regions, add them with signs.
Momentum-Time Graphs
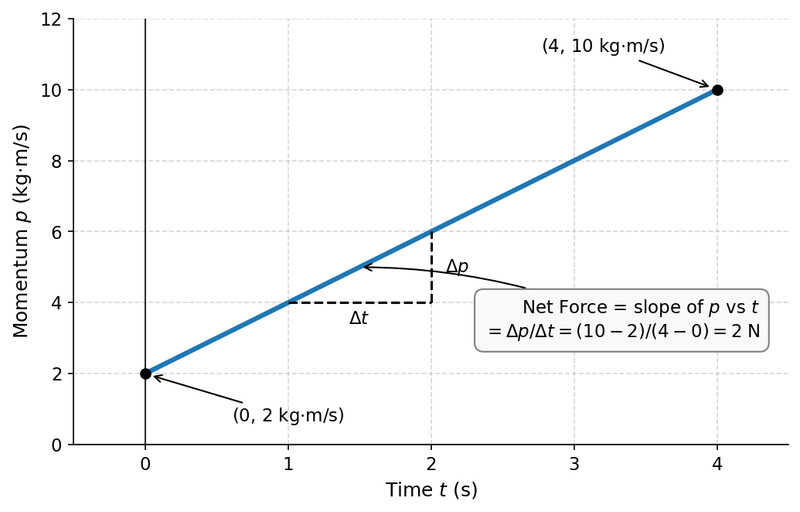
A momentum vs. time graph gives force through its slope:
In the graph below, momentum increases linearly from 2 kg·m/s at to 10 kg·m/s at s. The slope of that line is the net force.
Momentum vs. time graph with slope representing net force
- Steep slope → large force
- Flat line → zero net force
- Positive slope → force in positive direction
- Negative slope → force in negative direction
If the graph curves, the slope at a point represents the force at that instant.
Students often mix these up:
- Area under F-t → impulse
- Slope of p-t → force
Keep those straight.
Connecting It All
You can combine everything into one equation:
This is your go-to for problems involving stopping, collisions, or safety design.
Increasing stopping time decreases force for the same momentum change. That’s why padding, airbags, and helmets work. Same , bigger , smaller .
On written responses, always tie your reasoning to net external force causing a change in momentum. That language earns points.
