Topic 9.2 Notes – The Ideal Gas Law
1. What an Ideal Gas Is
An ideal gas is a simplified model. It is not describing real gases perfectly, but it gives us equations that work very well at low pressure and high temperature.
The Classical Assumptions
You need to know these four clearly, and be able to explain what each means physically.
- Random motion
- Particles move in constant, straight-line motion between collisions.
- Their instantaneous velocities are random in direction and speed.
- This randomness explains why pressure is uniform in all directions.
- Negligible particle volume
- The actual size of atoms/molecules is tiny compared to the container.
- Almost all the volume is empty space.
- So when we say “volume of the gas,” we really mean volume of the container.
- Elastic collisions
- Collisions conserve kinetic energy.
- No energy is lost when particles hit each other or the walls.
- This connects directly to temperature staying well-defined.
- No intermolecular forces (except during collisions)
- No attraction or repulsion at a distance.
- Particles only interact when they collide.
From this model:
- Pressure comes from collisions with the walls.
- Temperature measures average kinetic energy of the particles.
On FRQs, you may need to justify something like “pressure increases because collision frequency increases.” Tie it back to these assumptions.
2. The Ideal Gas Law
All those assumptions lead to one equation:
You should recognize both forms instantly.
Macroscopic form
- in pascals
- in cubic meters
- in moles
- in Kelvin
This is what you’ll usually use in calculations.
Microscopic form
- = number of particles
Connection:
This version emphasizes that temperature links directly to particle-level energy.
If a problem gives number of molecules instead of moles, this is your signal to use .
3. The Three Special Cases of the Ideal Gas Law
Each of these is just with one variable held constant.
| Law | Constant | Relationship | Equation Form |
|---|---|---|---|
| Boyle | T constant | ||
| Charles | P constant | ||
| Gay-Lussac | V constant |
Boyle’s Law
As volume decreases, pressure increases. On a vs. graph, this shows up as a downward-curving hyperbola.
This curve shape is something they love to test conceptually.
Charles’ Law
At constant pressure, volume increases linearly with temperature in Kelvin. A vs. graph should be a straight line.
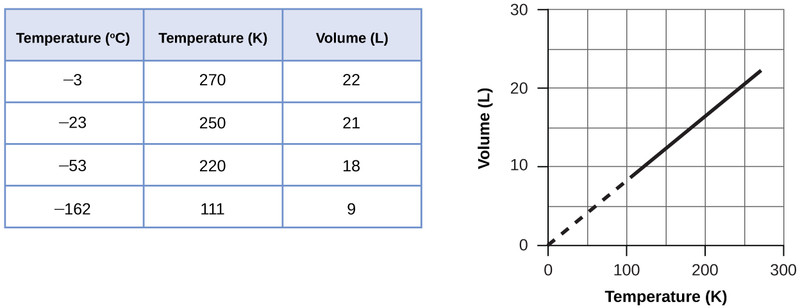
If the graph does not go through the origin, temperature is probably in Celsius.
Gay-Lussac’s Law
At constant volume, pressure increases linearly with temperature in Kelvin. A vs. graph is also a straight line.
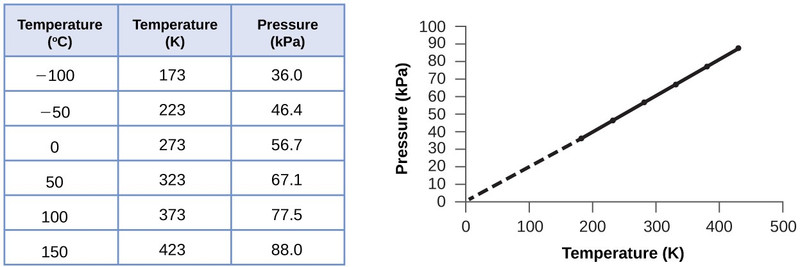
The big idea is that linear graphs only happen when temperature is measured in Kelvin.
4. Reading and Interpreting Gas Graphs
When you see a graph, immediately ask:
- What’s on each axis?
- What variable is constant?
- Is temperature in Kelvin?
Common interpretations:
- Curved P-V graph → temperature is constant.
- Straight-line V-T or P-T graph through origin → Kelvin scale.
- Steeper slope on a P-T graph → more moles (since slope relates to ).
On AP-style questions, they may show experimental data and ask if it behaves ideally. Look for linearity and proportionality.
5. Absolute Zero and Extrapolation
If you extend a P-T graph line downward until pressure hits zero, the temperature value is:
That is absolute zero.
Physically:
- Lower temperature → lower average kinetic energy.
- Slower particles → fewer and weaker collisions.
- At 0 K, ideal gas pressure would be zero.
The graph below shows pressure vs. temperature in degrees Celsius for several gases. Notice that each straight line extrapolates to zero pressure at about −273.15 °C, which corresponds to 0 K.
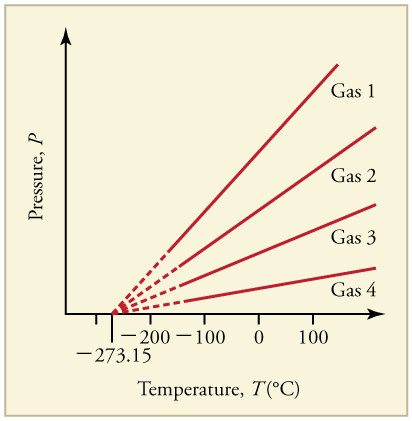
Extrapolating P-T lines to absolute zero
This is why Kelvin is defined the way it is. On conceptual questions, be ready to say that 0 K corresponds to minimum possible average kinetic energy.
