Topic 1.2 Notes – Variables
What Observational Units, Variables, and Data Are
In any study, the observational unit is the thing each row is about. It could be a person, but it could also be a tree, a school, a day, a transaction, or even a city-day combination.
A variable is a characteristic recorded on each observational unit that can vary from one unit to another. A data value is one recorded result for one unit. A data set is the full collection.
A quick table reminder helps here. In a data table like this one, each row is one observational unit and each column is a variable recorded for that unit.
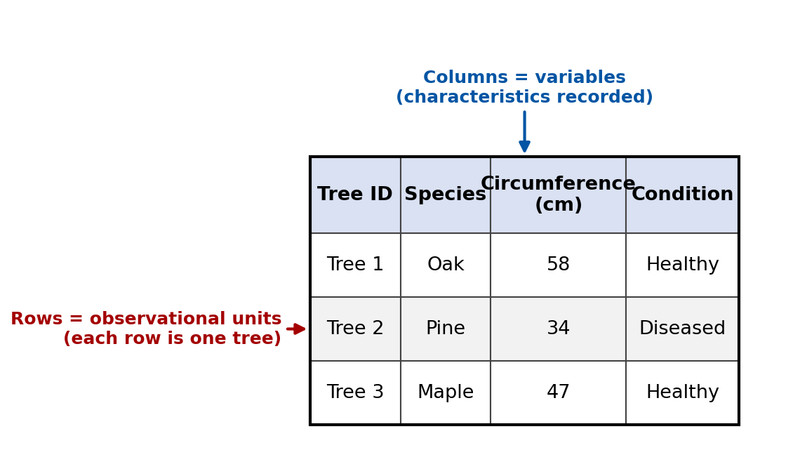
- Rows usually represent observational units
- Columns usually represent variables
A few easy traps:
- The observational unit is not the person collecting the data. If a worker measures trees, the trees are the units.
- Context decides the unit. One temperature per city means cities are units. One temperature per city per day can make each city-day one unit.
- A characteristic can still be a variable even if every sampled unit happened to get the same value.
- Something fixed for the whole study, like sample size or one common date, is not a variable measured on each unit.
- Data does not have to be just numbers in a spreadsheet. It can include labels, photos, audio, video, and text.
Types of Variables
There are two main types first. Every variable is either categorical or quantitative.
Categorical variables
A categorical variable gives group labels or category names.
Examples:
- blood type
- eye color
- school type
- yes/no response
Some have two categories, so they are binary. Some have many. Some are ordered, like poor/fair/good, but they are still categorical because the gaps are not numerical amounts.
Students get fooled by numbers here all the time:
- ZIP codes, ID numbers, jersey numbers, and codes like yes = 1, no = 2 are still categorical
- Arithmetic on those labels means nothing
Quantitative variables
A quantitative variable gives a numerical amount from measuring or counting. Differences between values mean something in context.
Examples:
- height in centimeters
- number of absences
- time in seconds
Usually, you should name the units too. The fastest check is this:
- Count or measure → probably quantitative
Exact wording matters:
- age in years completed → quantitative
- exact age → quantitative
- age groups like 0 to 17, 18 to 64, 65+ → categorical
Also, a proportion can come from categorical data and still be numerical. That does not make the original variable quantitative.
Types of Quantitative Variables
Once a variable is quantitative, split it into discrete or continuous.
Discrete quantitative variables
A discrete variable has countable possible values. It usually comes from counting.
Examples:
- number of goals
- number of complaints
- number of defects
There are gaps. You can have 2 complaints or 3 complaints, but not 2.4 complaints.
Continuous quantitative variables
A continuous variable can take any value in an interval. It usually comes from measuring.
Examples:
- height
- mass
- time
- temperature
This comparison makes the difference easy to see. Counts land on separate whole-number values, and measurements can fill in the interval between them.
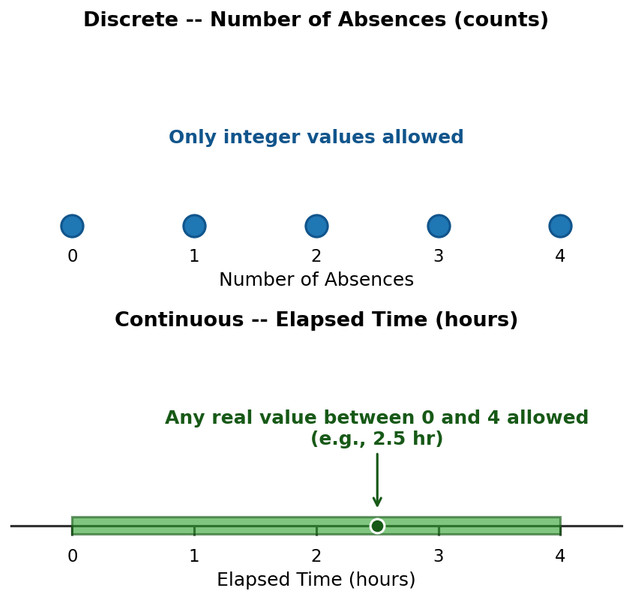
Rounding does not usually change the type. If time is recorded to the nearest tenth, the underlying variable is still continuous.
Wording controls the type:
- number of completed minutes → discrete
- exact elapsed time → continuous
Parameters and Statistics
A parameter is a numerical summary of a population. A statistic is a numerical summary of a sample.
Common notation:
- population proportion
- sample proportion
- population mean
- sample mean
- population standard deviation
- sample standard deviation
The same calculation can be either one. The difference is who it describes.
- Mean of all students in a school → parameter
- Mean of 100 sampled students → statistic
A parameter is fixed for that population and time, even if unknown. A statistic changes from sample to sample and is used to estimate the parameter.
Also important:
- It must be numerical to be a parameter or statistic
- One single observed value is just a data value
- A census of the whole population gives parameters
How to Identify Everything in a Study
When you read a study, move through it in this order:
- Name the population and sample, if given.
- Ask what each row or case represents. That gives the observational unit.
- List each characteristic recorded on that unit. Those are the variables.
- Classify each variable as categorical or quantitative.
- If quantitative, decide discrete or continuous.
- For any summary number, decide whether it describes a sample or the whole population.
Wording clues help:
| If you see... | Think... |
|---|---|
| all, every, entire population, true population | parameter |
| sample, surveyed, selected, observed | statistic |
Common mistakes:
- mixing up the unit with the data collector
- calling a digit label quantitative
- calling one observed value a statistic
- ignoring exact wording
- treating a huge sample as the population when it is still only a sample
Key Takeaways
Observational Unit
Item or individual from which a datum is collected
Variable
Characteristic that may change from one observational unit to another
Datum (Data Value)
One piece of information recorded for an observational unit; one recorded value
Categorical Variable (Qualitative Variable)
Variable whose values are category names or group labels
Quantitative Variable (Numerical Variable)
Variable whose values are numerical amounts that measure or count something, usually with units
Discrete Quantitative Variable
Quantitative variable with a countable number of possible values
Continuous Quantitative Variable
Quantitative variable that can take any value within a given interval
Parameter vs. Statistic
Parameter describes a population; statistic describes a sample
Notes
Observational Unit
Item or individual from which a datum is collected
Variable
Characteristic that may change from one observational unit to another
Datum (Data Value)
One piece of information recorded for an observational unit; one recorded value
Categorical Variable (Qualitative Variable)
Variable whose values are category names or group labels
Quantitative Variable (Numerical Variable)
Variable whose values are numerical amounts that measure or count something, usually with units
Discrete Quantitative Variable
Quantitative variable with a countable number of possible values
Continuous Quantitative Variable
Quantitative variable that can take any value within a given interval
Parameter vs. Statistic
Parameter describes a population; statistic describes a sample
