Topic 2.11 Notes – The Normal Distribution
What a Normal Distribution Is
A continuous random variable can take any value in an interval, like height, time, or temperature. Since it can land anywhere, probability comes from intervals, not exact single values.
A normal distribution is a density curve that is:
- continuous
- unimodal with one peak
- bell-shaped
- symmetric
The familiar bell curve also follows the empirical rule shown here.
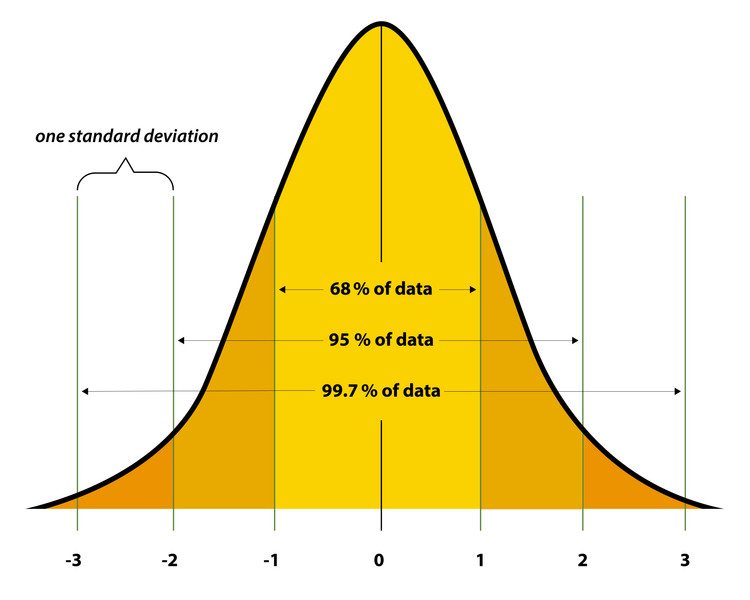
Normal curve and the 68-95-99.7 rule
A few facts all go together here:
- The total area under the curve is 1.
- That means area = probability = proportion = percent.
- For continuous variables, . A single point has no area.
- So . Including the endpoint changes nothing.
The curve is determined by two parameters:
- Mean gives the center.
- Standard deviation gives the spread.
If , AP Stats means the second number is the standard deviation, not variance.
Changing shifts the whole curve left or right. Changing changes width:
- smaller → narrower and taller
- larger → wider and shorter
In a normal distribution, mean = median = mode at the center. A normal model is reasonable when data look roughly symmetric, unimodal, and bell-shaped, with no strong skew or extreme outliers.
Z-scores and the Standard Normal
A z-score tells you where a value sits relative to the mean in standard deviation units.
- positive → above the mean
- negative → below the mean
- larger → farther from the mean, more extreme
The standard normal distribution is .
Standardizing keeps the normal shape and relative position, but changes the scale. That is why z-scores let you compare values from different distributions.
Example: on a test with , , a score of 86 has
So 86 is 2 standard deviations above the mean.
To go backward, use
If the middle 95% runs from 40 to 64, those are about and . The midpoint is , and , so .
The Empirical Rule
For any normal distribution, about:
- 68% of values are within of
- 95% are within
- 99.7% are within
The diagram also breaks that total area into the smaller chunks you will use for quick probability estimates.
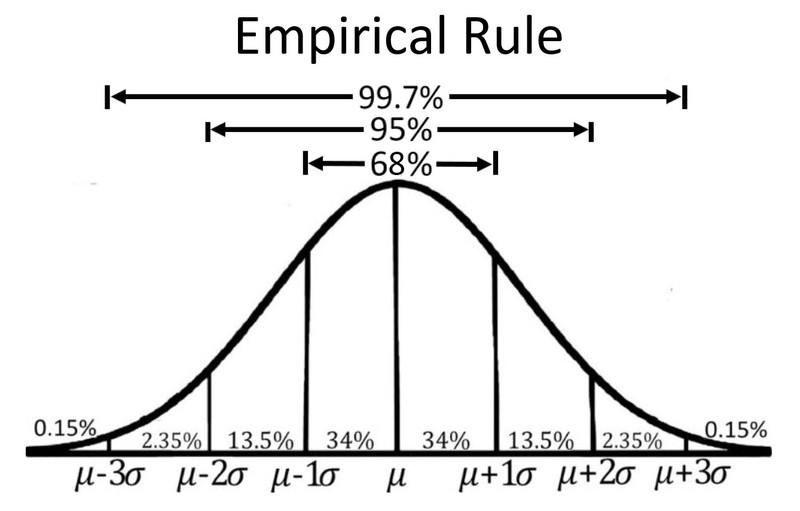
Empirical rule for a normal distribution
Useful split areas:
- to on either side → 34%
- to → 13.5%
- to → 2.35%
- beyond in each tail → 0.15%
This is great for quick estimates and cutoff values like . It is only approximate, only for normal distributions, and mostly useful at exactly 1, 2, or 3 standard deviations.
Finding Areas and Finding Cutoffs
When a value is given and you want a probability:
- Write the probability in context.
- Decide if it is left-tail, right-tail, or between.
- If the boundary is exactly 1, 2, or 3 SDs from the mean, use the empirical rule.
- Otherwise use or technology.
- For right-tail area, subtract from 1 if your tool gives left-tail area.
Calculator commands:
- normalcdf(lower, upper, ) for area
- invNorm(left-tail area, ) for cutoffs
When an area is given and you want a value:
- lower means
- upper means convert to left-tail area
- middle means split the leftover area evenly into two tails
- most extreme means split evenly across both tails
Then find , and convert back with .
Percentiles, Relative Position, and Common Mistakes
The th percentile is the value with about of observations at or below it. So percentile, area, and z-score are all connected:
area/percentile.
To compare positions across distributions, use z-scores or percentiles, not raw values.
Common mistakes show up a lot on tests:
- treating curve height as probability
- using the empirical rule on non-normal data
- forgetting probability is over an interval
- putting an upper-tail percent directly into invNorm
- confusing middle with most extreme
- forgetting endpoints do not matter for continuous distributions
Key Takeaways
Continuous Random Variable
A variable that can take any value in an interval; probabilities are assigned to intervals, not single points
Density Curve
A curve representing a continuous probability distribution; probability is area under the curve and total area is 1
Normal Distribution
A continuous probability distribution with a unimodal, bell-shaped, symmetric density curve, determined by mean μ and standard deviation σ.
Parameters of a Normal Distribution
μ gives the center and σ gives the spread; larger σ makes the curve wider and shorter, smaller σ makes it narrower and taller
Standard Normal Distribution
The normal distribution with mean 0 and standard deviation 1; written Z ~ N(0,1)
Z-Score
A standardized value showing how many standard deviations a raw value is above or below the mean: z = (x - μ)/σ.
Standardization
Converting x to z with z = (x - μ)/σ; if X ~ N(μ, σ), then Z ~ N(0, 1)
Reverse Standardization
Converting from z back to the original scale with x = μ + zσ.
Probability as Area Under a Normal Curve
For a normal random variable, the probability of an interval equals the area under the curve over that interval; total area is 1
Standard Normal Table
A table of cumulative left-tail probabilities P(Z ≤ z) for the standard normal distribution
normalcdf
Technology command that gives the probability or area for an interval under a normal distribution: normalcdf(lower, upper, μ, σ)
invNorm
Technology command that gives the cutoff value for a specified left-tail area in a normal distribution: invNorm(left-tail area, μ, σ)
Percentile
The pth percentile is a value with about p% of the distribution at or below it
Measures of Relative Position: Percentile vs. Z-Score
Percentile gives the proportion at or below a value; z-score gives signed distance from the mean in standard deviation units
Lower-Tail Cutoff
A boundary x_a with P(X ≤ x_a) = p% ; the lowest p% of values lie at or below x_a
Upper-Tail Cutoff
A boundary x_b with P(X ≥ x_b) = p% ; equivalently, P(X ≤ x_b) = 1 - p% in proportion form
Central Interval
An interval with P(x_a ≤ X ≤ x_b) = p%; the remaining area, 100% - p%, is split equally between the two tails
Most Extreme p%
The combined p% in both tails of a normal distribution, split equally so P(X ≤ x_a) = (p/2)% and P(X ≥ x_b) = (p/2)%.
Empirical Rule (68–95–99.7 Rule)
For a normal distribution, about 68% of values lie within 1 standard deviation of the mean, 95% within 2, and 99.7% within 3
P(X = a) for a Continuous Random Variable
P(X = a) = 0; probabilities for continuous variables come from intervals, not single points
Strict vs. Inclusive Inequalities for Continuous Distributions
For a continuous random variable, including or excluding an endpoint does not change the probability: P(X < a) = P(X ≤ a)
Notes
Continuous Random Variable
A variable that can take any value in an interval; probabilities are assigned to intervals, not single points
Density Curve
A curve representing a continuous probability distribution; probability is area under the curve and total area is 1
Normal Distribution
A continuous probability distribution with a unimodal, bell-shaped, symmetric density curve, determined by mean μ and standard deviation σ.
Parameters of a Normal Distribution
μ gives the center and σ gives the spread; larger σ makes the curve wider and shorter, smaller σ makes it narrower and taller
Standard Normal Distribution
The normal distribution with mean 0 and standard deviation 1; written Z ~ N(0,1)
Z-Score
A standardized value showing how many standard deviations a raw value is above or below the mean: z = (x - μ)/σ.
Standardization
Converting x to z with z = (x - μ)/σ; if X ~ N(μ, σ), then Z ~ N(0, 1)
Reverse Standardization
Converting from z back to the original scale with x = μ + zσ.
Probability as Area Under a Normal Curve
For a normal random variable, the probability of an interval equals the area under the curve over that interval; total area is 1
Standard Normal Table
A table of cumulative left-tail probabilities P(Z ≤ z) for the standard normal distribution
normalcdf
Technology command that gives the probability or area for an interval under a normal distribution: normalcdf(lower, upper, μ, σ)
invNorm
Technology command that gives the cutoff value for a specified left-tail area in a normal distribution: invNorm(left-tail area, μ, σ)
Percentile
The pth percentile is a value with about p% of the distribution at or below it
Measures of Relative Position: Percentile vs. Z-Score
Percentile gives the proportion at or below a value; z-score gives signed distance from the mean in standard deviation units
Lower-Tail Cutoff
A boundary x_a with P(X ≤ x_a) = p% ; the lowest p% of values lie at or below x_a
Upper-Tail Cutoff
A boundary x_b with P(X ≥ x_b) = p% ; equivalently, P(X ≤ x_b) = 1 - p% in proportion form
Central Interval
An interval with P(x_a ≤ X ≤ x_b) = p%; the remaining area, 100% - p%, is split equally between the two tails
Most Extreme p%
The combined p% in both tails of a normal distribution, split equally so P(X ≤ x_a) = (p/2)% and P(X ≥ x_b) = (p/2)%.
Empirical Rule (68–95–99.7 Rule)
For a normal distribution, about 68% of values lie within 1 standard deviation of the mean, 95% within 2, and 99.7% within 3
P(X = a) for a Continuous Random Variable
P(X = a) = 0; probabilities for continuous variables come from intervals, not single points
Strict vs. Inclusive Inequalities for Continuous Distributions
For a continuous random variable, including or excluding an endpoint does not change the probability: P(X < a) = P(X ≤ a)
