Topic 3.5 Notes – Setting Up a Test for a Population Proportion
What a One-Sample z-Test for a Population Proportion Is
This test is for one population proportion, written as . That means you are asking about the true proportion in a population that has some outcome of interest.
You use it when all of these are true:
- there is one population
- there is one sample
- the response variable is categorical
- you can code responses as success/failure
A success is just the category you care about. It does not mean “good.”
- If the variable is “defective or not defective,” then “defective” can be success.
- If the variable has several categories, that still works if you combine them into two groups. Example: “supports” = success, and “neutral or opposes” = failure.
The parameter and statistic are easy to mix up:
- = the true population proportion
- = the sample proportion, found by
Hypotheses are always about , never about , because is already known from your sample.
This is not the right procedure for:
- estimating a proportion with a confidence interval
- comparing two groups
- working with quantitative data
Writing the Parameter and Hypotheses
Your parameter definition needs three pieces:
- the population
- the success category
- that it is a population proportion
Example:
- = the true proportion of all students at Central High who prefer later school start times
The null hypothesis has the form
Here, is the claimed or benchmark proportion, and it must be between 0 and 1.
The alternative depends on the wording:
- lower-tailed
- upper-tailed
- two-sided
Wording clues:
- less than, below, lower, decreased
- greater than, above, higher, increased
- different, changed, not equal
One thing AP loves here. The null gets the equality. Even if the situation sounds like “at least 60%,” AP Stats writes the test as .
That last wording clue matches a two-sided test, where extreme results in either direction count against .
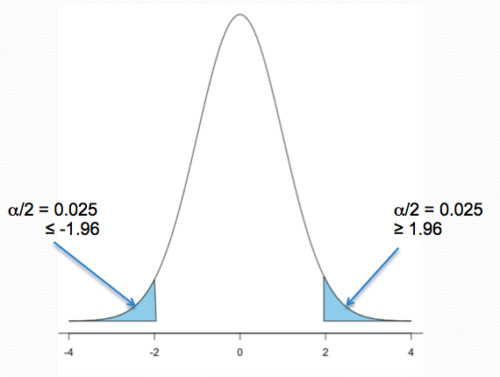
Two-tailed rejection regions
How to Set Up the Test
This setup follows a clean order:
- Identify the response variable.
- Define what counts as success.
- Name the parameter in context.
- Decide whether this is a one-sample -test for a population proportion.
- Find the null value from the claim.
- Write .
- Choose from the question wording, not from the sample result.
- State whether the test is one-sided or two-sided.
- Check conditions before doing any test statistic or p-value work.
Quick recognition checklist:
- one sample
- one population
- categorical response
- proportion of successes is the target
Conditions for Using the Test
All three conditions must be justified.
Randomization condition
The data should come from a random sample. You justify this from how the sample was selected, not by saying the sample size is large.
A big sample does not fix a biased method like a convenience sample.
10% condition
If sampling without replacement, you need
This is about approximate independence. It compares sample size to population size. It is not the same as “your sample has to be big.”
Normality condition
Use expected counts under the null, so use , not :
You must check expected successes and expected failures separately.
That differs from a confidence interval, where the check uses the sample counts based on .
What Students Mix Up
These are the mistakes that show up all the time:
- Writing hypotheses with instead of
- Picking the direction of because the sample proportion ended up above or below
- Forgetting to define success clearly
- Using this test for two groups or for quantitative data
- Using observed counts for normality instead of expected counts under
- Taking from the sample instead of from the claim
- Saying “random” without saying how the sample was chosen
- Mixing up the 10% condition with the large-counts condition
- Trying to finish the whole test here when this topic only covers correct setup
Key Takeaways
One-Sample z-Test for a Population Proportion
Appropriate test for a claim about the proportion of successes in one population, using one sample and a categorical response classified as success/failure
Population Proportion Parameter (p)
The true population proportion of individuals classified as successes
Null Hypothesis (H₀)
Statement about the population proportion assumed true unless the sample gives convincing evidence otherwise; status quo
Alternative Hypothesis (Hₐ)
Statement about the population proportion describing the departure from H₀ that the evidence is meant to support
Null Hypothesized Value (p₀)
The specified population proportion in H₀: p = p₀
Two-Sided Alternative
Alternative hypothesis p ≠ p₀, used when the question asks whether the proportion is different in either direction
Lower-Tailed Alternative
Hₐ: p < p₀; used when the question asks whether the population proportion is less than the null value
Upper-Tailed Alternative
Hₐ: p > p₀; used when the question asks whether the population proportion is greater than the null value
Equality in the Null Hypothesis
In AP Statistics, even for a one-sided test, write the null as H₀: p = p₀ and test at the equality boundary
Randomization Condition
Data must come from a random sample from the population of interest
10% Condition
When sampling without replacement, population size must satisfy N ≥ 10n so observations are approximately independent
Normality Condition
Under H₀, the expected counts np₀ and n(1 − p₀) must both be at least 10
Parameter in Context
Define p by naming the population, the success outcome or response variable, and that p is a population proportion
Notes
One-Sample z-Test for a Population Proportion
Appropriate test for a claim about the proportion of successes in one population, using one sample and a categorical response classified as success/failure
Population Proportion Parameter (p)
The true population proportion of individuals classified as successes
Null Hypothesis (H₀)
Statement about the population proportion assumed true unless the sample gives convincing evidence otherwise; status quo
Alternative Hypothesis (Hₐ)
Statement about the population proportion describing the departure from H₀ that the evidence is meant to support
Null Hypothesized Value (p₀)
The specified population proportion in H₀: p = p₀
Two-Sided Alternative
Alternative hypothesis p ≠ p₀, used when the question asks whether the proportion is different in either direction
Lower-Tailed Alternative
Hₐ: p < p₀; used when the question asks whether the population proportion is less than the null value
Upper-Tailed Alternative
Hₐ: p > p₀; used when the question asks whether the population proportion is greater than the null value
Equality in the Null Hypothesis
In AP Statistics, even for a one-sided test, write the null as H₀: p = p₀ and test at the equality boundary
Randomization Condition
Data must come from a random sample from the population of interest
10% Condition
When sampling without replacement, population size must satisfy N ≥ 10n so observations are approximately independent
Normality Condition
Under H₀, the expected counts np₀ and n(1 − p₀) must both be at least 10
Parameter in Context
Define p by naming the population, the success outcome or response variable, and that p is a population proportion
