Topic 4.3 Notes – Justifying a Claim Based on a Confidence Interval for a Population Mean or Population Mean Difference
What a Confidence Interval for a Mean Says
Here, the parameter is either the population mean or, for matched pairs, the population mean of differences .
For one sample, the interval has form
For matched pairs, you first compute a difference for each pair in a stated order, then use
In that paired formula, is the number of pairs, not the total number of observations.
A confidence interval gives a range of plausible values for the population parameter.
- The midpoint is the point estimate, so it equals or .
- The half-width is the margin of error.
- The units of the interval and parameter match the response variable. If the variable is minutes, the interval is in minutes.
For paired data, the subtraction order matters a lot. If you define difference as before minus after, then a negative interval means the after values tend to be larger.
The picture below connects this idea to repeated sampling. Each horizontal interval comes from a different sample, and most of them capture the true mean .
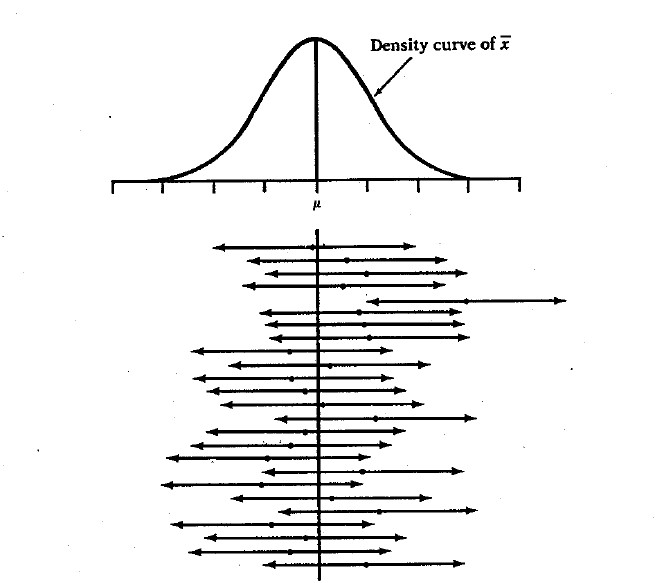
Repeated confidence intervals for a population mean
This topic assumes the interval was built correctly and conditions were already checked.
Interpreting the Interval and the Confidence Level
If a confidence interval is , the right interpretation is:
- “We are confident that the interval from to contains the true population mean of …”
- For matched pairs, say and include the subtraction order.
Example in context:
- “We are 95% confident that the interval from 4.1 to 6.3 minutes contains the true mean bus delay for all weekday trips on this route.”
For paired data:
- “We are 95% confident that the interval from to seconds contains the true mean difference in completion time, defined as condition A minus condition B, for adults like those in the study.”
The confidence level is about long-run success of the method.
- In repeated random sampling, about of intervals from this method would capture the true parameter.
- The parameter stays fixed.
- The interval changes from sample to sample.
- Your one computed interval either contains the true value or it doesn’t.
What you should not say:
- “There is a probability the true mean is in this interval.”
- “ of individuals are between the endpoints.”
- “This is an interval for the sample mean.”
For matched pairs, means no population mean difference.
Using the Interval to Judge a Claim
This is one of the most tested skills in this topic.
- Identify the claim’s value, usually or .
- Compare that value to the whole interval.
- Write a conclusion in context using evidence language.
Here’s the decision chart:
- If is outside the interval, there is evidence against .
- If the entire interval is above , there is evidence that .
- If the entire interval is below , there is evidence that .
- If is inside the interval, the data are consistent with . There is not convincing evidence of a difference.
For paired differences:
- If is outside the interval, there is evidence of a nonzero mean difference.
- If the whole interval is negative or positive, that gives direction.
- Then translate the sign using your subtraction order.
Example: if and the interval for is , then is outside the interval and the whole interval is negative. That supports a mean difference, with A lower than B.
Use wording like:
- “The interval provides convincing evidence that…”
- “The interval does not provide convincing evidence that…”
A value equal to an endpoint counts as in the interval.
How Confidence Level and Sample Size Change the Interval
The margin of error is
The full width is
If you raise the confidence level for the same sample:
- gets bigger
- margin of error gets bigger
- interval gets wider
- midpoint stays the same
If you increase sample size:
- gets smaller
- the interval tends to get narrower
Width is approximately proportional to .
- Double width becomes about times as large
- Quadruple width is about half as large
A larger sample improves precision. It does not guarantee the interval center moves closer to a claimed value.
Scope and Common Mistakes
Your conclusion is only valid if the -interval procedure was appropriate.
- For matched pairs, conditions apply to the differences, not the two raw lists separately.
- Random sampling supports generalizing to the population.
- Random assignment supports cause-and-effect in experiments.
Common mistakes:
- Mixing up with from two independent samples
- Forgetting to define subtraction order
- Talking about individual values instead of the population mean
- Judging a claim from the sample mean alone instead of the entire interval
Key Takeaways
Confidence Interval Interpretation for μ or μd
“We are C% confident that the interval from a to b contains the true population mean or true population mean difference for the population of interest,” stated in context; for paired data, include the order of subtraction
Confidence Level Interpretation
In repeated random sampling from the same population with the same sample size, about C% of confidence intervals constructed by this method will contain the true population mean or true population mean difference
Population Mean Difference (μd)
The population mean of one population of paired differences, defined using a specified order such as first measurement minus second measurement
Matched-Pairs Order of Subtraction
The defined order used to compute each pair’s difference; it determines the meaning and sign of μd and must be stated in the interpretation
Plausible Values
The values of μ or μd inside a confidence interval; they are reasonably consistent with the sample data at that confidence level
Claimed Value Outside the Interval
If k is outside a C% confidence interval, the interval provides evidence against μ = k or μd = k; if the whole interval is above k, there is evidence the parameter is greater than k, and if the whole interval is below k, there is evidence it is less than k
Claimed Value Inside the Interval
If k is in the interval, the data are consistent with μ = k or μd = k, so there is not convincing evidence at that level that the parameter differs from k
Zero in a Matched-Pairs Confidence Interval
For matched pairs, 0 means no population mean difference; if 0 is outside the interval, there is evidence that μd is not 0, and if the whole interval is above or below 0, the sign shows the direction based on the defined order of subtraction
Endpoint Inclusion
A value equal to a reported endpoint is treated as being in the interval, though rounding can make boundary conclusions uncertain
Margin of Error
The half-width of a confidence interval; for a one-sample or matched-pairs t-interval, t*·s/√n
Interval Width
The full length of the confidence interval; for a one-sample or matched-pairs t-interval, 2t*·s/√n
Effect of Increasing Confidence Level
t* increases, so margin of error increases and the interval gets wider; the midpoint stays the same
Effect of Increasing Sample Size
Holding confidence level and variability approximately constant, increasing n decreases the standard error, so the margin of error and interval width tend to decrease
Width Approximately Proportional to 1/√n
For a fixed confidence level, interval width is approximately proportional to 1/√n
Confidence Interval and Two-Sided Significance Test Connection
A two-sided C% confidence interval and a two-sided test at α = 1 - C/100 give corresponding conclusions: if k is outside the interval, reject H₀: μ = k; if k is in the interval, fail to reject, aside from rounding
Connection with Two-Sided Significance Tests
A two-sided C% confidence interval and a two-sided test at α = 1 - C/100 give corresponding conclusions: if k is outside the interval, reject H₀: μ = k; if k is in the interval, fail to reject
Notes
Confidence Interval Interpretation for μ or μd
“We are C% confident that the interval from a to b contains the true population mean or true population mean difference for the population of interest,” stated in context; for paired data, include the order of subtraction
Confidence Level Interpretation
In repeated random sampling from the same population with the same sample size, about C% of confidence intervals constructed by this method will contain the true population mean or true population mean difference
Population Mean Difference (μd)
The population mean of one population of paired differences, defined using a specified order such as first measurement minus second measurement
Matched-Pairs Order of Subtraction
The defined order used to compute each pair’s difference; it determines the meaning and sign of μd and must be stated in the interpretation
Plausible Values
The values of μ or μd inside a confidence interval; they are reasonably consistent with the sample data at that confidence level
Claimed Value Outside the Interval
If k is outside a C% confidence interval, the interval provides evidence against μ = k or μd = k; if the whole interval is above k, there is evidence the parameter is greater than k, and if the whole interval is below k, there is evidence it is less than k
Claimed Value Inside the Interval
If k is in the interval, the data are consistent with μ = k or μd = k, so there is not convincing evidence at that level that the parameter differs from k
Zero in a Matched-Pairs Confidence Interval
For matched pairs, 0 means no population mean difference; if 0 is outside the interval, there is evidence that μd is not 0, and if the whole interval is above or below 0, the sign shows the direction based on the defined order of subtraction
Endpoint Inclusion
A value equal to a reported endpoint is treated as being in the interval, though rounding can make boundary conclusions uncertain
Margin of Error
The half-width of a confidence interval; for a one-sample or matched-pairs t-interval, t*·s/√n
Interval Width
The full length of the confidence interval; for a one-sample or matched-pairs t-interval, 2t*·s/√n
Effect of Increasing Confidence Level
t* increases, so margin of error increases and the interval gets wider; the midpoint stays the same
Effect of Increasing Sample Size
Holding confidence level and variability approximately constant, increasing n decreases the standard error, so the margin of error and interval width tend to decrease
Width Approximately Proportional to 1/√n
For a fixed confidence level, interval width is approximately proportional to 1/√n
Confidence Interval and Two-Sided Significance Test Connection
A two-sided C% confidence interval and a two-sided test at α = 1 - C/100 give corresponding conclusions: if k is outside the interval, reject H₀: μ = k; if k is in the interval, fail to reject, aside from rounding
Connection with Two-Sided Significance Tests
A two-sided C% confidence interval and a two-sided test at α = 1 - C/100 give corresponding conclusions: if k is outside the interval, reject H₀: μ = k; if k is in the interval, fail to reject
