Topic 3.1 Notes – Estimators
What an Estimator Is
When AP Stats talks about estimation, it means using a sample to say something about a population.
- A parameter is a number that describes a population. It is fixed, but usually unknown.
- Example: = the proportion of all registered voters in a city who support a bond measure.
- A statistic is a number calculated from a sample.
- Example: = the proportion of sampled voters who support the measure.
- An estimator is that statistic viewed as a rule for estimating a parameter.
- Same formula, different idea. is the rule you use to estimate .
- A point estimate is the actual number you got from one sample.
- If 92 of 160 sampled voters support the measure, then . The point estimate is 0.575.
That context matters. “The proportion” is too vague on the AP exam. Say whose proportion it is.
Common Point Estimators
These are the pairs you should recognize immediately:
- estimates
A common test move is asking you to “calculate an estimate of the population parameter.” That usually means compute the matching sample statistic.
Also keep this straight now, because it matters later. A point estimate is one number from one sample. It is not a range. Confidence intervals come later.
What Unbiased Means
An estimator is unbiased when its long-run average hits the true parameter.
Its bias is
So:
- bias means unbiased
- positive bias means it overestimates on average
- negative bias means it underestimates on average
The figure compares those two cases by showing where the sampling distribution is centered.
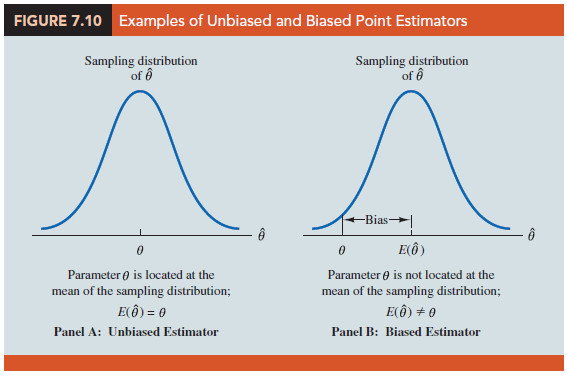
This is about the center of the sampling distribution, not one sample result. One estimate can be too high and the estimator can still be unbiased.
For sample proportion, if is the number of successes in a random sample of size , then . Since ,
So is unbiased for .
Two easy traps:
- unbiased does not mean always correct
- unbiased does not mean low spread
How to Justify Whether an Estimator Is Unbiased
When you have to justify this, your answer needs the parameter, the estimator, and the center.
- Identify the parameter in context.
- Example: = proportion of all students at the school who own a car.
- Identify the estimator.
- Example: = proportion in the random sample who own a car.
- Compare the estimator’s long-run mean to the parameter.
Ways this can show up:
- If the sampling distribution mean is given, compare it directly to the parameter.
- If a probability distribution is given, compute
- If all possible samples are listed, find the estimator for each, average with probabilities, then compare.
- If a graph or simulation is shown, check whether it is centered at the parameter.
- If an algebraic estimator is given, find and see whether for all parameter values.
Your conclusion should say unbiased, overestimates on average, or underestimates on average.
Bias, Variability, and Common Traps
Bias is center. Variability is spread.
An estimator can be:
- unbiased but very spread out
- biased but tightly clustered
- unbiased and tightly clustered
If two estimators are both unbiased, the one with less variability is usually better.
This figure gives quick visual examples of that idea. For this section, focus on the panels where the curves have the same mean and compare how wide or narrow they are.
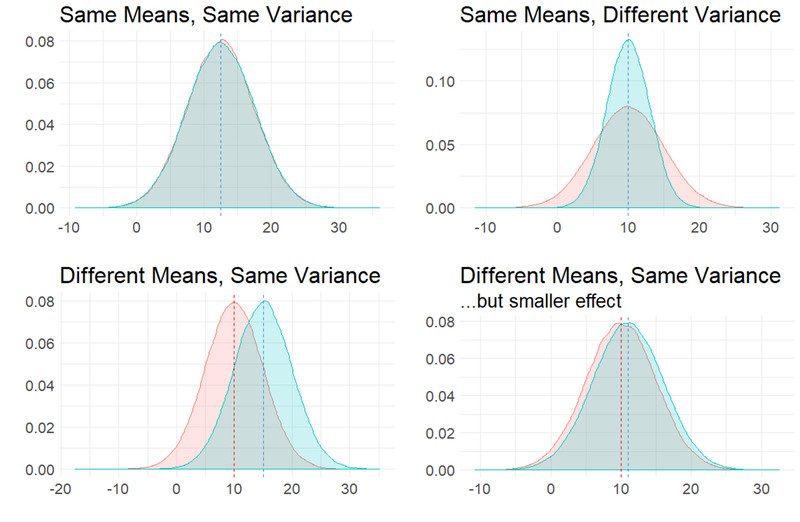
Distributions with the same mean and different spread
Larger sample size usually reduces variability, but it does not automatically remove bias. A huge voluntary response sample can still give biased results because the sampling method is flawed.
Common AP mistakes:
- saying an estimator is unbiased because one estimate is close
- saying it is unbiased because one estimate equals the parameter
- saying it is unbiased because the sample is large
- calling a symmetric distribution unbiased without checking whether it is centered at the parameter
Key Takeaways
Population Parameter
Numerical characteristic of a population; fixed for that population but usually unknown
Sample Statistic
Numerical value calculated from sample data; used to learn about a population parameter
Estimator
Rule that uses sample data to estimate an unknown population parameter; often a statistic used for that purpose
Point Estimator
An estimator that produces a single numerical value as its estimate
Point Estimate
The single numerical value produced by a point estimator from one particular sample
Unbiased Estimator
An estimator whose mean over all possible random samples equals the population parameter; E(θ̂) = θ
Bias Of An Estimator
E(θ̂) - θ; positive means overestimates on average, negative means underestimates on average
Sampling Distribution
Distribution of the values of a statistic over all possible samples of a given size from the same random process
Sample Proportion p̂ And Population Proportion p
p̂ = x/n estimates p, where p is the population proportion and p̂ is the sample proportion; once calculated from one sample, the observed value of p̂ is the point estimate
Sample Mean x̄ And Population Mean μ
x̄ estimates μ
Sample Standard Deviation s And Population Standard Deviation σ
s estimates σ
Difference In Sample Proportions p̂₁ - p̂₂ And Difference In Population Proportions p₁ - p₂
p̂₁ - p̂₂ estimates p₁ - p₂
Difference In Sample Means x̄₁ - x̄₂ And Difference In Population Means μ₁ - μ₂
x̄₁ - x̄₂ estimates μ₁ - μ₂
Center Vs Spread Of An Estimator
Bias is about the center of the sampling distribution; variability is about its spread
Notes
Population Parameter
Numerical characteristic of a population; fixed for that population but usually unknown
Sample Statistic
Numerical value calculated from sample data; used to learn about a population parameter
Estimator
Rule that uses sample data to estimate an unknown population parameter; often a statistic used for that purpose
Point Estimator
An estimator that produces a single numerical value as its estimate
Point Estimate
The single numerical value produced by a point estimator from one particular sample
Unbiased Estimator
An estimator whose mean over all possible random samples equals the population parameter; E(θ̂) = θ
Bias Of An Estimator
E(θ̂) - θ; positive means overestimates on average, negative means underestimates on average
Sampling Distribution
Distribution of the values of a statistic over all possible samples of a given size from the same random process
Sample Proportion p̂ And Population Proportion p
p̂ = x/n estimates p, where p is the population proportion and p̂ is the sample proportion; once calculated from one sample, the observed value of p̂ is the point estimate
Sample Mean x̄ And Population Mean μ
x̄ estimates μ
Sample Standard Deviation s And Population Standard Deviation σ
s estimates σ
Difference In Sample Proportions p̂₁ - p̂₂ And Difference In Population Proportions p₁ - p₂
p̂₁ - p̂₂ estimates p₁ - p₂
Difference In Sample Means x̄₁ - x̄₂ And Difference In Population Means μ₁ - μ₂
x̄₁ - x̄₂ estimates μ₁ - μ₂
Center Vs Spread Of An Estimator
Bias is about the center of the sampling distribution; variability is about its spread
