Topic 3.14 Notes – Setting Up a Chi-Square Test for Homogeneity or Independence
What Chi-Square Tests in a Two-Way Table
A chi-square test works with a table of counts. Each cell shows how many individuals fall into that combination of categories.
You compare observed counts from the data to expected counts from the null model. The null model says what the table should look like if were true.
The chi-square statistic measures how different the observed and expected counts are:
- For one cell, the contribution is .
- The total adds those contributions across all cells.
- If observed and expected counts are close, stays small.
- If they differ a lot, gets large.
A bigger chi-square statistic means more disagreement with , so the p-value is always right-tailed.
Expected counts can be decimals. That is normal because they are model-based predictions, not actual observed people.
The graph below shows chi-square distributions for several degrees of freedom.
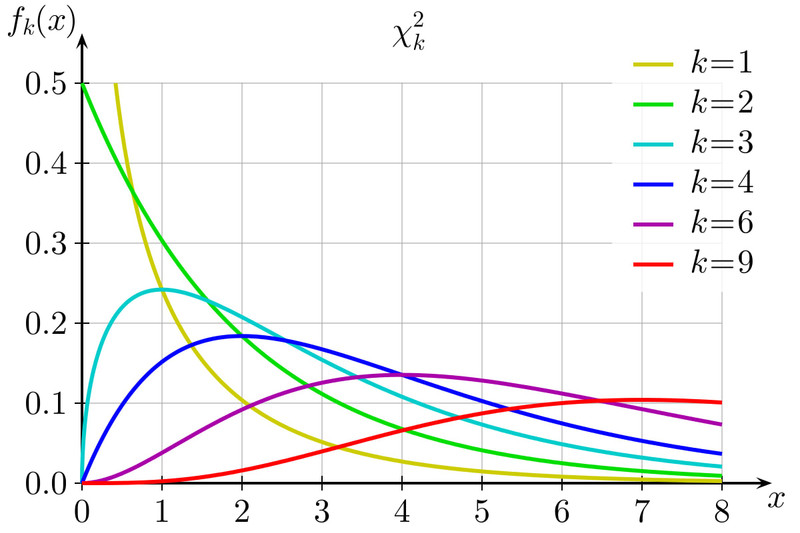
Chi-square distributions for several degrees of freedom
Chi-square distributions have a few features you need to know:
- values are never negative
- shape is skewed right
- as degrees of freedom increase, the curve becomes less skewed
Choosing Between Homogeneity and Independence
The math is the same for both tests. The name depends on how the data were collected.
Homogeneity
A chi-square test for homogeneity compares the distribution of one categorical variable across two or more populations or treatment groups.
Examples:
- Compare favorite music genre across grades 9, 10, 11, and 12
- Compare response categories across treatment groups in an experiment
Language clue: Do these groups have the same distribution?
Independence
A chi-square test for independence checks whether two categorical variables are associated in one population.
Example:
- From one random sample of students, record grade level and whether each student has a part-time job
Language clue: Are these two variables associated? or Are they independent?
Quick rule
- One sample, two variables, one population → independence
- Multiple samples or randomized groups, one response variable → homogeneity
A common trap is the phrase independent random samples. That can appear in a homogeneity problem. It describes sampling method, not the name of the test.
Hypotheses and Expected Counts
Chi-square hypotheses are written in words and context. You do not write them with means or one proportion.
Homogeneity hypotheses
- The distribution of the categorical variable is the same across the populations or treatments.
- The distributions are not all the same.
That means at least one group differs. It does not tell you which one.
Independence hypotheses
- The two categorical variables are independent in the population.
- The two categorical variables are associated in the population.
Expected counts for any cell come from
If a row total is 40, a column total is 30, and the grand total is 120, then
For homogeneity, expected counts show what the table would look like if all groups had the same distribution. For independence, they show what the table would look like if the variables were unrelated.
Conditions for a Chi-Square Test
You need three conditions.
Randomization
- Independence test uses one random sample.
- Homogeneity test uses independent random samples or random assignment in an experiment.
10% condition
- If sampling without replacement, check .
- For homogeneity with separate samples, check each sample against its population.
- You do not need this for a randomized experiment.
Large expected counts
- Every expected count must be greater than 5.
- Check expected counts, not observed counts.
If a condition fails, the standard chi-square procedure is not justified.
How to Set Up the Test and Avoid Common Mistakes
When you set up the test, keep the logic in this order:
- Identify the observational units and the categorical variables.
- Decide whether the design gives homogeneity or independence.
- State and in context.
- Check randomization, the 10% condition if needed, and expected counts .
- Compute expected counts if asked.
Common mistakes show up a lot on quizzes and FRQs:
- using percents instead of counts in the table
- picking the test from the table alone instead of from the study design
- saying is that “all cell counts are equal”
- writing a directional alternative like “Group A is higher”
- saying a significant result proves causation from a random sample
- saying fail to reject proves the variables are independent
Key Takeaways
Chi-Square Test for Homogeneity
Compares the distribution of one categorical variable across two or more populations or treatment groups
Chi-Square Test for Independence
Determines whether two categorical variables are associated within one population, using one random sample with both variables recorded on each individual
Observed Count
The actual count recorded in a cell of the two-way table
Expected Count
The count expected in a cell if H₀ is true; expected count = (row total × column total) / table total
Chi-Square Statistic
Measures overall distance between observed and expected counts relative to expected counts; sum of (O − E)² / E over all cells
Chi-Square Distribution
A family of right-skewed distributions with only nonnegative values; skew decreases as degrees of freedom increase
Chi-Square Test for Homogeneity: H₀ and Hₐ
H₀: the distribution of the categorical variable is the same across populations or treatments; Hₐ: the distributions are not all the same
Chi-Square Test for Independence: H₀ and Hₐ
H₀: the two categorical variables are independent, or there is no association, in the population; Hₐ: they are not independent, or there is an association
Randomization Condition
For independence: data come from a random sample from one population; for homogeneity: data come from independent random samples from the populations being compared or from a randomized experiment
10% Condition
When sampling without replacement, n ≤ 10% of N; for homogeneity with separate samples, check each sample against its population; not needed for a randomized experiment
Expected-Count Condition
Every expected cell count must be greater than 5
How to Choose Homogeneity vs. Independence
One sample from one population, with two categorical variables measured on each individual → chi-square test for independence; separate samples from populations or separate randomized treatment groups, with one categorical response recorded → chi-square test for homogeneity
Counts-Only Requirement
The cells of the two-way table must contain counts, not percentages, proportions, measurements, or summary statistics
Notes
Chi-Square Test for Homogeneity
Compares the distribution of one categorical variable across two or more populations or treatment groups
Chi-Square Test for Independence
Determines whether two categorical variables are associated within one population, using one random sample with both variables recorded on each individual
Observed Count
The actual count recorded in a cell of the two-way table
Expected Count
The count expected in a cell if H₀ is true; expected count = (row total × column total) / table total
Chi-Square Statistic
Measures overall distance between observed and expected counts relative to expected counts; sum of (O − E)² / E over all cells
Chi-Square Distribution
A family of right-skewed distributions with only nonnegative values; skew decreases as degrees of freedom increase
Chi-Square Test for Homogeneity: H₀ and Hₐ
H₀: the distribution of the categorical variable is the same across populations or treatments; Hₐ: the distributions are not all the same
Chi-Square Test for Independence: H₀ and Hₐ
H₀: the two categorical variables are independent, or there is no association, in the population; Hₐ: they are not independent, or there is an association
Randomization Condition
For independence: data come from a random sample from one population; for homogeneity: data come from independent random samples from the populations being compared or from a randomized experiment
10% Condition
When sampling without replacement, n ≤ 10% of N; for homogeneity with separate samples, check each sample against its population; not needed for a randomized experiment
Expected-Count Condition
Every expected cell count must be greater than 5
How to Choose Homogeneity vs. Independence
One sample from one population, with two categorical variables measured on each individual → chi-square test for independence; separate samples from populations or separate randomized treatment groups, with one categorical response recorded → chi-square test for homogeneity
Counts-Only Requirement
The cells of the two-way table must contain counts, not percentages, proportions, measurements, or summary statistics
