Topic 2.2 Notes – Summary Statistics for Two Categorical Variables
What Relative Frequencies in a Two-Way Table Mean
A two-way table shows counts for individuals classified by two categorical variables. The inside cells show combinations, and the margins show totals.
Use this park visitor table as the running example for the relative frequencies in this section.
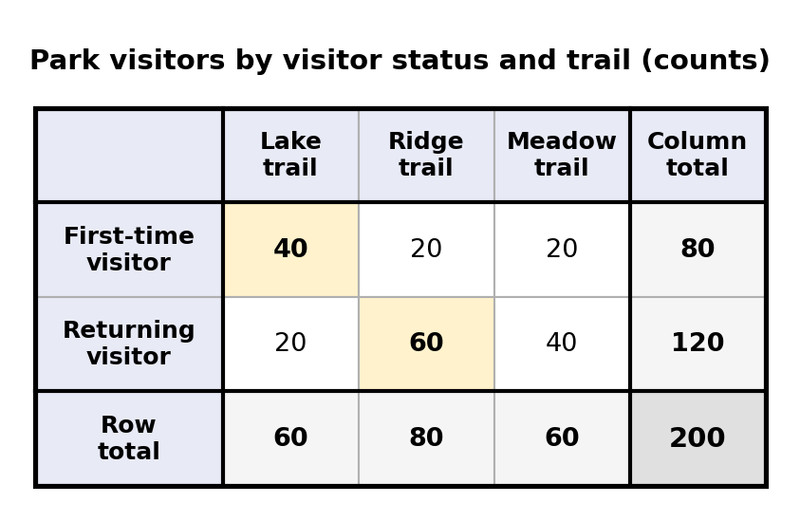
The whole topic comes down to one idea. The denominator decides the meaning.
- Joint relative frequency uses a cell count divided by the grand total
- Marginal relative frequency uses a row total or column total divided by the grand total
- Conditional relative frequency uses a cell count divided by a row total or column total
Quick denominator check:
- “out of all individuals” means grand total
- “overall proportion in one category” means grand total
- “among,” “of those,” or “given” means a restricted row or column total
One cell can answer different questions. In the table, 40 people are first-time visitors who chose Lake, so:
- first-time given Lake is
- Lake given first-time is
Same numerator. Different denominator. Different meaning.
Joint, Marginal, and Conditional Relative Frequencies
Joint relative frequencies
These describe a specific combination out of the whole table.
Example from the table:
Interpretation: 30% of all sampled visitors were returning visitors who chose the Ridge trail.
Marginal relative frequencies
These describe one variable by itself and ignore the other.
Examples:
- Returning visitors:
- Ridge trail:
You can also get marginals by adding joint relative frequencies. Ridge is .
Conditional relative frequencies
These describe one variable within a category of the other.
Examples:
- Ridge among first-time visitors:
- Ridge among returning visitors:
A row-conditional table has each row sum to 1. A column-conditional table has each column sum to 1.
You can also compute a conditional from relative frequencies:
What students mix up a lot is this: a joint relative frequency table has all interior cells adding to 1, but a conditional table does not work that way unless you sum within each conditioned row or column.
How to Calculate the Right Summary
When a problem is wordy, translate it in this order:
- Identify the question in words.
- Find the reference group.
- all individuals
- one row group
- one column group
- Pick the denominator that matches that group.
- Divide the correct count by that denominator.
- Write the answer in context.
Useful cues:
- “proportion of all” → grand total
- “proportion of X who are Y” → condition on X
- “proportion of Y that are X” → condition on Y
Common trap: you grab the right cell for the numerator, then divide by the wrong margin.
Comparing Conditional Distributions to Look for Association
To decide whether two categorical variables are associated, compare conditional distributions.
For the park table:
- Among first-time visitors, trail choices are , ,
- Among returning visitors, trail choices are about , ,
Those are clearly different, especially for Lake and Ridge. That’s evidence of an association between visitor status and trail choice.
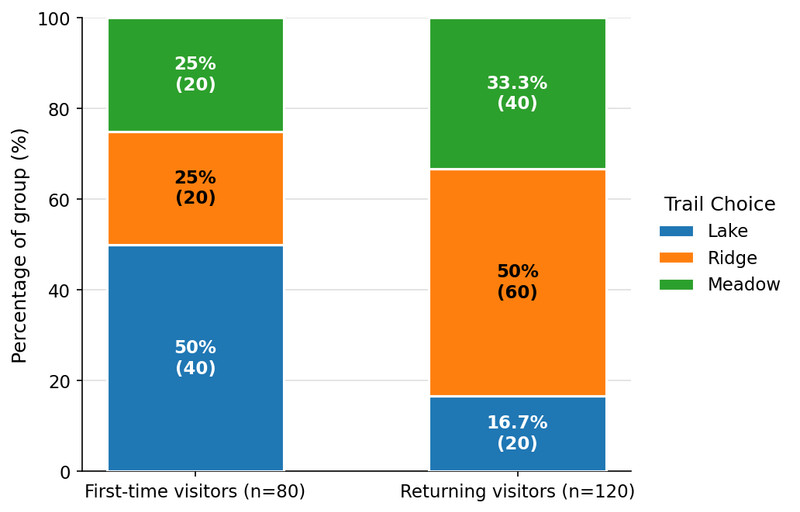
Conditional distributions of trail choice by visitor status
The segmented bars make that comparison quick because each group is scaled to 100% even though the sample sizes are different.
If there were no association, the conditional distributions would be the same, or very close, across groups. Raw counts alone are weak evidence because groups can be different sizes.
Association is symmetric, but one direction is often clearer in context.
Writing Conclusions and Avoiding Common Mistakes
A good interpretation includes:
- the number
- the categories involved
- the denominator group
- the real-world context
Good comparison sentence:
“Among returning visitors, 50% selected the Ridge trail, compared with 25% among first-time visitors.”
Good association conclusion:
“In this sample, visitor status and trail choice appear associated because returning visitors chose the Ridge trail at a higher rate and the Lake trail at a lower rate than first-time visitors.”
Mistakes that cost points:
- comparing raw counts when group sizes differ
- leaving out “among” so the denominator is unclear
- using marginal percentages to claim association
- saying correlation instead of association
- making a causal claim from table summaries alone
- generalizing to a population without random sampling
Key Takeaways
Two-Way Table; Contingency Table
Table that summarizes counts for individuals classified by two categorical variables
Joint Relative Frequency
Interior cell frequency divided by the grand total; proportion of all individuals in a particular combination of categories
Marginal Relative Frequency
Row total or column total divided by the grand total; describes one variable’s distribution ignoring the other
Conditional Relative Frequency
Cell frequency divided by the total for the conditioning row or column; describes a distribution within a specified category of the other variable
Conditional Distribution
Set of conditional relative frequencies for one variable within a given category of the other variable; each conditioned row or column sums to 1
Association
For two categorical variables, the conditional distribution of one variable differs across categories of the other; equivalently, knowing one variable gives information about the other
No Association
The conditional distribution of one variable is the same across categories of the other; knowing one variable does not change the relative frequencies of the other
Compare Conditional Relative Frequencies
To assess association, compare corresponding conditional relative frequencies across groups; raw counts alone are generally not sufficient
Notes
Two-Way Table; Contingency Table
Table that summarizes counts for individuals classified by two categorical variables
Joint Relative Frequency
Interior cell frequency divided by the grand total; proportion of all individuals in a particular combination of categories
Marginal Relative Frequency
Row total or column total divided by the grand total; describes one variable’s distribution ignoring the other
Conditional Relative Frequency
Cell frequency divided by the total for the conditioning row or column; describes a distribution within a specified category of the other variable
Conditional Distribution
Set of conditional relative frequencies for one variable within a given category of the other variable; each conditioned row or column sums to 1
Association
For two categorical variables, the conditional distribution of one variable differs across categories of the other; equivalently, knowing one variable gives information about the other
No Association
The conditional distribution of one variable is the same across categories of the other; knowing one variable does not change the relative frequencies of the other
Compare Conditional Relative Frequencies
To assess association, compare corresponding conditional relative frequencies across groups; raw counts alone are generally not sufficient
