Topic 3.12 Notes – Setting Up a Test for the Difference Between Two Population Proportions
What a Test for Two Population Proportions Is
This test compares two populations or two independent treatment groups on a binary categorical outcome.
- Binary categorical means there are two outcomes, like support/do not support, passed/did not pass, recovered/did not recover.
- Success means the outcome you care about. It does not have to be good. If the study is about getting sick, then “success” could be “got sick.”
The parameter is
where and are the true population proportions of success.
The sample statistics are
where is the number of successes and is the sample size.
Use this when:
- the response variable has two categories
- the groups are independent
- the question asks whether one proportion is bigger, smaller, or different
Do not use it for:
- comparing means of quantitative data
- paired or matched data
Be careful with order. If you define the parameter as , then a positive result means A’s proportion is larger. Reverse the order, and the sign and one-sided hypothesis direction reverse too.
Hypotheses for
The null says no difference:
The alternative depends on the wording:
- “higher,” “greater,” “more likely”
- “lower,” “less”
- “different,” “not the same,” “has an effect”
A common trap is choosing the direction after seeing the sample results. On the AP exam, the direction comes from the research question, not from which sample proportion happened to be bigger.
Also, hypotheses are always about population proportions , never sample proportions .
Why Pooling Happens Under the Null
If says , then both groups are assumed to share one common proportion. So we estimate that common value by pooling the samples:
This is a weighted average, so the larger sample has more influence.
A two-way display like this is a good way to picture the setup. Each group has its own observed counts, but under the null you combine the successes and totals to estimate one shared proportion.
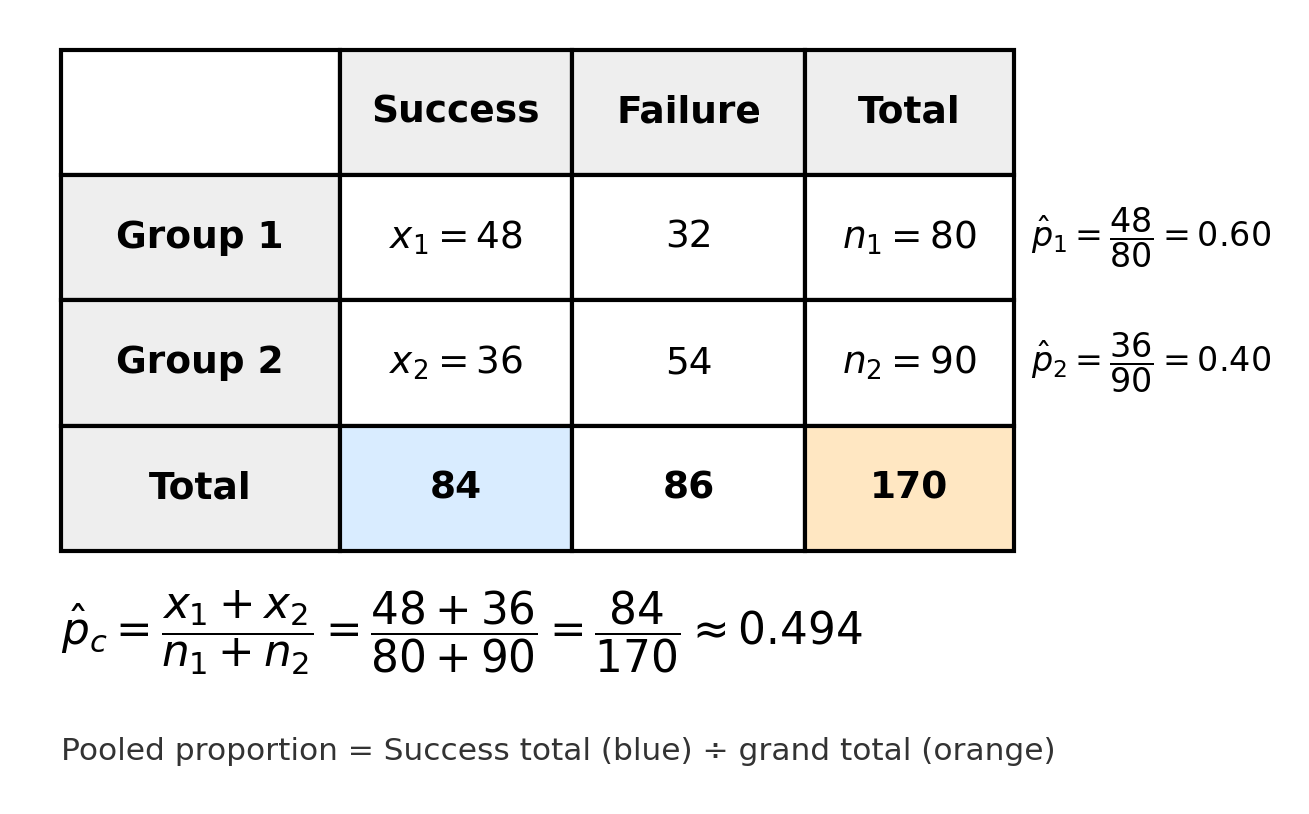
Two-way table of group counts and outcomes. Group 1 has and Group 2 has ; pooling uses the Success total over the grand total, , which falls between them.
You use here because the null assumes equal proportions. That pooled proportion is used for the large-counts check in this test. It is not used to describe each group’s observed proportion, and it is not used in a confidence interval for .
Conditions for a Valid Two-Sample -Test
All three conditions must be checked in context.
Randomization and independent groups
You need either:
- two independent random samples, or
- a randomized experiment with independent treatment groups
Random sampling lets you generalize to a population. Random assignment lets you talk about cause and effect. Big sample sizes do not fix bad sampling.
10% condition
This matters for random samples taken without replacement from finite populations:
Check it separately for each group. You do not need this for a randomized experiment.
Large counts condition
Because the null assumes one common proportion, use the pooled proportion:
These are expected successes and failures in each group under the null. This is what justifies the normal approximation.
How to Write a Complete Setup and What to Avoid
A good setup sounds like this:
- Define the parameters in context.
= true proportion of all voters in District A who support the measure.
= true proportion of all voters in District B who support the measure. - State hypotheses with the correct direction.
- Name the procedure.
Two-sample -test for a difference between two population proportions - Verify randomization, 10% condition if needed, and large counts.
Common mistakes:
- writing hypotheses with instead of
- mixing up subtraction order and inequality direction
- forgetting groups must be independent
- checking large counts with separate and instead of
- mixing up the 10% condition with the large-counts condition
- trying to calculate the test statistic here. This topic stops at setup.
Key Takeaways
Two-Sample Z-Test for the Difference Between Two Population Proportions
Use to test whether two population proportions differ for a binary categorical outcome in two independent populations or independently formed treatment groups
Parameter for a Difference in Two Population Proportions
p₁ - p₂, where p₁ and p₂ are the true population proportions of success for the two populations or treatments
Complete Parameter Definition
Define each parameter by naming the population or treatment, the success category, and that it is a population proportion, not a sample proportion
Order of Parameters
The order in p₁ - p₂ determines the sign of the difference and the direction of any one-sided alternative
Hypotheses Use Population Proportions, Not Sample Proportions
Write hypotheses about p₁ and p₂, not p̂₁ and p̂₂, because the test is about unknown population parameters
Null Hypothesis for Two Proportions
H₀: p₁ = p₂, equivalently H₀: p₁ - p₂ = 0; it states no difference between population proportions
Alternative Hypotheses for Two Proportions
Hₐ: p₁ > p₂, Hₐ: p₁ < p₂, or Hₐ: p₁ ≠ p₂; equivalently, write them as p₁ - p₂ > 0, p₁ - p₂ < 0, or p₁ - p₂ ≠ 0
Choose Alternative from the Research Question
Higher/more likely/increases → >; lower/less/decreases → <; different/not the same/has an effect → ≠; choose the direction before looking at the sample results
Equality in the Null Hypothesis
For this test, the null is ordinarily written with equality: p₁ = p₂ or p₁ - p₂ = 0
Randomization Condition for a Two-Proportion Z-Test
Data must come from two independent random samples or from a randomized experiment with random assignment to independently formed treatment groups
10% Condition for a Two-Proportion Z-Test
When sampling without replacement, check separately that n₁ ≤ 0.10N₁ and n₂ ≤ 0.10N₂.
When the 10% Condition Is Unnecessary
It is not needed for a randomized experiment or when sampling is effectively with replacement
Normality (Large-Counts) Condition for a Two-Proportion Z-Test
Using the pooled proportion p̂_c under H₀, all four expected counts must be at least 10: n₁p̂_c, n₁(1 - p̂_c), n₂p̂_c, and n₂(1 - p̂_c)
Meaning of the Four Expected Counts
They are the expected successes and failures in each group under the null hypothesis of equal population proportions
Independent Groups Requirement
The two groups must be independent; this procedure is not for paired data, matched pairs, or repeated measurements on the same individuals
10% Condition vs. Large-Counts Condition
The 10% condition supports approximate independence when sampling without replacement; the large-counts condition supports the normal approximation
Pooled Proportion
p̂_c = (x₁ + x₂) / (n₁ + n₂) = (n₁p̂₁ + n₂p̂₂) / (n₁ + n₂); used because H₀ assumes p₁ = p₂, so both groups share one common population proportion
Notes
Two-Sample Z-Test for the Difference Between Two Population Proportions
Use to test whether two population proportions differ for a binary categorical outcome in two independent populations or independently formed treatment groups
Parameter for a Difference in Two Population Proportions
p₁ - p₂, where p₁ and p₂ are the true population proportions of success for the two populations or treatments
Complete Parameter Definition
Define each parameter by naming the population or treatment, the success category, and that it is a population proportion, not a sample proportion
Order of Parameters
The order in p₁ - p₂ determines the sign of the difference and the direction of any one-sided alternative
Hypotheses Use Population Proportions, Not Sample Proportions
Write hypotheses about p₁ and p₂, not p̂₁ and p̂₂, because the test is about unknown population parameters
Null Hypothesis for Two Proportions
H₀: p₁ = p₂, equivalently H₀: p₁ - p₂ = 0; it states no difference between population proportions
Alternative Hypotheses for Two Proportions
Hₐ: p₁ > p₂, Hₐ: p₁ < p₂, or Hₐ: p₁ ≠ p₂; equivalently, write them as p₁ - p₂ > 0, p₁ - p₂ < 0, or p₁ - p₂ ≠ 0
Choose Alternative from the Research Question
Higher/more likely/increases → >; lower/less/decreases → <; different/not the same/has an effect → ≠; choose the direction before looking at the sample results
Equality in the Null Hypothesis
For this test, the null is ordinarily written with equality: p₁ = p₂ or p₁ - p₂ = 0
Randomization Condition for a Two-Proportion Z-Test
Data must come from two independent random samples or from a randomized experiment with random assignment to independently formed treatment groups
10% Condition for a Two-Proportion Z-Test
When sampling without replacement, check separately that n₁ ≤ 0.10N₁ and n₂ ≤ 0.10N₂.
When the 10% Condition Is Unnecessary
It is not needed for a randomized experiment or when sampling is effectively with replacement
Normality (Large-Counts) Condition for a Two-Proportion Z-Test
Using the pooled proportion p̂_c under H₀, all four expected counts must be at least 10: n₁p̂_c, n₁(1 - p̂_c), n₂p̂_c, and n₂(1 - p̂_c)
Meaning of the Four Expected Counts
They are the expected successes and failures in each group under the null hypothesis of equal population proportions
Independent Groups Requirement
The two groups must be independent; this procedure is not for paired data, matched pairs, or repeated measurements on the same individuals
10% Condition vs. Large-Counts Condition
The 10% condition supports approximate independence when sampling without replacement; the large-counts condition supports the normal approximation
Pooled Proportion
p̂_c = (x₁ + x₂) / (n₁ + n₂) = (n₁p̂₁ + n₂p̂₂) / (n₁ + n₂); used because H₀ assumes p₁ = p₂, so both groups share one common population proportion
