Topic 3.8 Notes – Potential Errors When Performing Tests
What Type I Error, Type II Error, and Power Are
In a test, is the null claim and is the alternative claim you’re looking for evidence for. Your sample leads to a decision, but reality is separate from that decision.
That’s exactly what this 2-by-2 decision grid is showing:
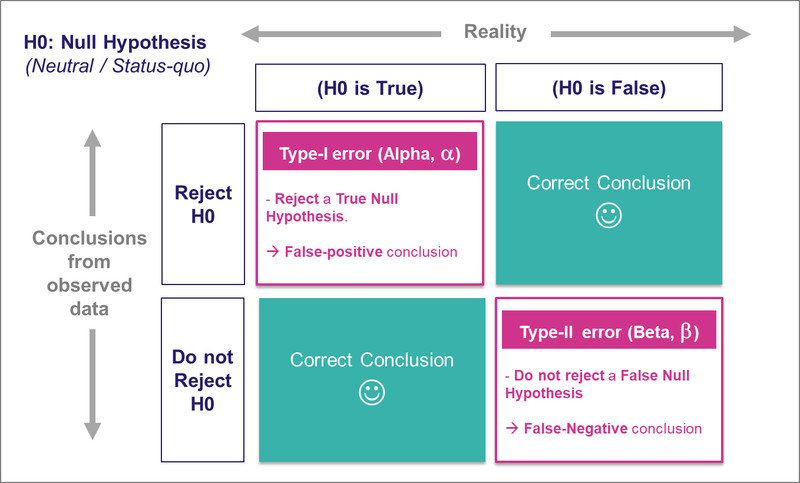
Hypothesis testing outcomes
- Type I error means you reject when is actually true.
- You say there is convincing evidence for , but that claim is false.
- Type II error means you fail to reject when is actually false.
- You miss a real effect or difference.
- Power is the probability that the test correctly rejects a false null hypothesis.
One wording issue matters a lot on tests. Reject means “the data give convincing evidence for .” Fail to reject means “the data do not give convincing evidence for .” It does not mean you proved .
Probabilities Attached to the Errors
The probability of a Type I error is the significance level, .
Common choices are , , and . This is chosen before collecting data.
The probability of a Type II error is . Unlike , usually depends on which true value under you mean. Missing a tiny real difference is more likely than missing a huge one.
The connection to power is
So if power is , then . If , then power is .
Common trap:
- is not the probability that is true.
- Power is not the probability that is true.
How to Identify and Write Each Error in Context
This is where AP Stats loves to be picky. You need the error in words tied to the situation.
Suppose and , where is the true proportion of students at a school who buy lunch.
- Translate the hypotheses.
- says 30% buy lunch.
- says more than 30% buy lunch.
- For a Type I error
- Decision made: conclude there is convincing evidence that more than 30% buy lunch.
- Truth: the true proportion is actually 30%.
- For a Type II error
- Decision made: conclude there is not convincing evidence that more than 30% buy lunch.
- Truth: the true proportion is actually greater than 30%.
Include these pieces every time:
- the population
- the parameter/variable
- the actual claim or value
- whether evidence was found or not found
Common mistakes:
- saying “accept ”
- giving only a consequence like “the school orders too much food”
- mixing up the test decision with what is actually true
What Changes and Power
Four things lower and raise power:
- larger sample size
- smaller standard error
- a true value farther from the null
- larger
This picture helps tie those ideas together. It shows the null and alternative distributions for a right-tailed test, along with the cutoff that separates the rejection region from the non-rejection region.
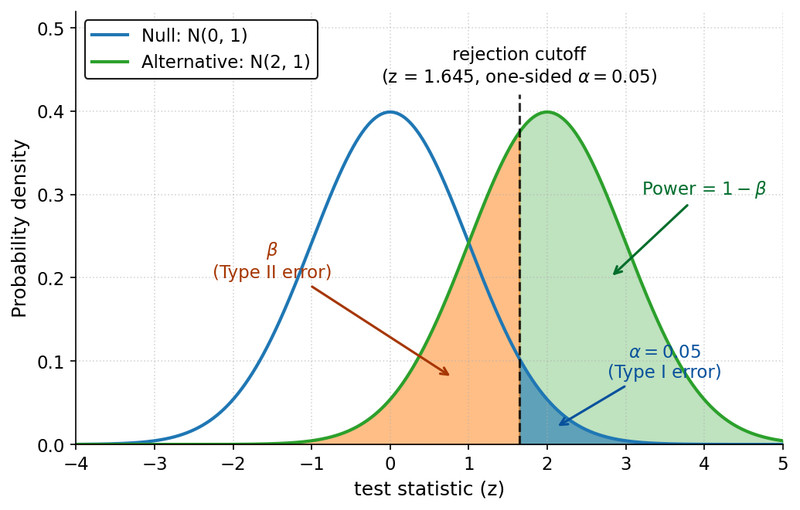
Power, , and on overlapping sampling distributions
Why each one works:
- Larger shrinks variability, so real differences are easier to detect.
- Smaller standard error means less overlap between null and alternative distributions.
- A true value close to the null is hard to detect. Farther away is easier.
- Larger moves the cutoff so rejection is easier, so power goes up, but Type I error also goes up.
Choosing , Choosing Sample Size, and Exam Pitfalls
If a Type I error would be very serious, choose a smaller . If a Type II error would be very serious, plan for a larger sample size and stronger power.
A common target is power , so , but context decides what matters most. Neither error is automatically worse.
These errors can happen even when the test is done correctly. They are different from bad arithmetic, biased sampling, or failed conditions. Also, statistical significance only says the data give evidence against . It does not say the effect is large or important in real life.
Key Takeaways
Type I Error
Rejecting a true H₀; concluding there is convincing evidence for Hₐ when H₀ is actually true; false positive
Type II Error
Failing to reject a false H₀; concluding there is not convincing evidence for Hₐ when H₀ is actually false; false negative
Power
Probability of correctly rejecting H₀ when H₀ is false; power = 1 - β.
Significance Level (α)
The probability of a Type I error; chosen before data collection, often 0.01, 0.05, or 0.10
Type II Error Probability (β)
Probability of a Type II error: failing to reject H₀ when H₀ is false; β = 1 - power for a specified true parameter value
Factors That Decrease Type II Error and Increase Power
Holding other factors constant: larger sample size, smaller standard error, a true parameter value farther from the null value, or a larger α.
Error-Consequence Decision Rule
If a Type I error would be more serious, choose a smaller α; if a Type II error would be more serious, plan a larger sample size to reduce β and increase power
Trade-Off Between Type I And Type II Error
With other features fixed, decreasing α lowers the chance of a Type I error but raises β and lowers power; increasing α does the opposite
Notes
Type I Error
Rejecting a true H₀; concluding there is convincing evidence for Hₐ when H₀ is actually true; false positive
Type II Error
Failing to reject a false H₀; concluding there is not convincing evidence for Hₐ when H₀ is actually false; false negative
Power
Probability of correctly rejecting H₀ when H₀ is false; power = 1 - β.
Significance Level (α)
The probability of a Type I error; chosen before data collection, often 0.01, 0.05, or 0.10
Type II Error Probability (β)
Probability of a Type II error: failing to reject H₀ when H₀ is false; β = 1 - power for a specified true parameter value
Factors That Decrease Type II Error and Increase Power
Holding other factors constant: larger sample size, smaller standard error, a true parameter value farther from the null value, or a larger α.
Error-Consequence Decision Rule
If a Type I error would be more serious, choose a smaller α; if a Type II error would be more serious, plan a larger sample size to reduce β and increase power
Trade-Off Between Type I And Type II Error
With other features fixed, decreasing α lowers the chance of a Type I error but raises β and lowers power; increasing α does the opposite
