Topic 4.9 Notes – Setting Up a Test for the Difference Between Two Population Means
When to Use a Two-Sample t-Test for Means
A two-sample -test for means is for comparing the means of a quantitative response variable in two independent groups.
You use it when:
- you have two groups and want to compare their average values
- the groups are independent
- either two independent random samples
- or two treatments assigned independently in a randomized experiment
- the parameter of interest is the difference in population means,
- the population standard deviations are unknown, which is why this is a -test
The test is built around the sample difference . If the population means are equal, that difference should be around 0 just from random chance. If the observed difference is far enough from 0, that becomes evidence against equal population means.
Similar-looking procedures
This is where a lot of students lose points.
- Matched pairs
- same people measured twice, or subjects deliberately paired
- you do not use a two-sample test
- instead, compute each pair’s difference and use a one-sample -test on those differences
- Two-proportion -test
- used when the response variable is categorical such as yes/no or success/failure
- if the question is about proportions, it is not a test for means
You do not need:
- equal sample sizes
- equal population variances
- pooled variances
Parameters and Hypotheses in Context
Your parameters must name the population and the quantitative variable. Units should be included when they matter.
Example:
- = mean breaking strength, in newtons, of all parts made at Plant A this week
- = mean breaking strength, in newtons, of all parts made at Plant B this week
If the data are shown in side-by-side boxplots like these, the test is comparing population means for the groups, even though the graph itself displays sample distributions.
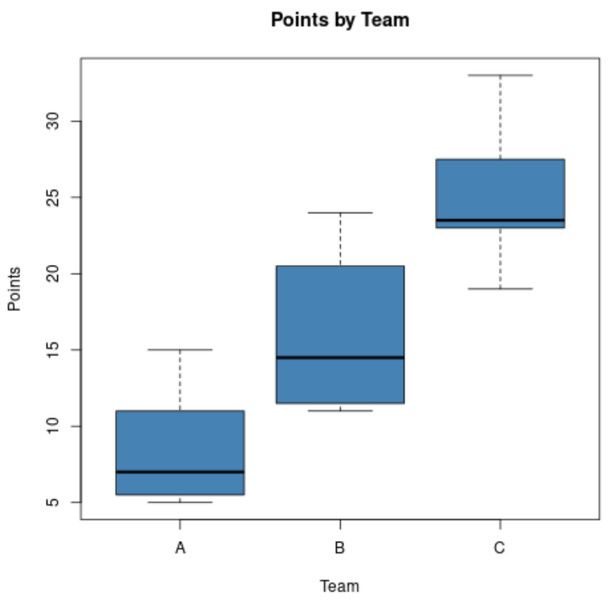
Side-by-side boxplots for quantitative groups
The subtraction order
If you choose , keep that same order everywhere:
- parameter
- hypotheses
- sample statistic
- conclusion
A positive value means group A has the larger mean.
Hypotheses
Null hypothesis:
Equivalent form:
Alternative hypotheses:
- two-sided
- right-sided
- left-sided
Wording clues:
- “different” or “not the same” → two-sided
- “greater,” “higher,” “longer” → right-sided if group 1 is claimed larger
- “less,” “lower,” “shorter” → left-sided if group 1 is claimed smaller
Common mistakes:
- writing hypotheses with and instead of and
- switching subtraction order halfway through
- picking one-sided or two-sided based on the sample results
Conditions for the Test
You need three conditions, and on AP you have to check them in context.
Randomization
The data must come from:
- two independent random samples, or
- a randomized experiment with independent treatment assignment
Random assignment supports treatment comparison. Random sampling supports generalizing to a population. A large sample does not fix missing randomization.
10% condition
For sampling without replacement, check both groups separately:
This is about independence, not normality. You do not need this for randomized experiments.
Sample data condition
- If and , you’re good.
- If both populations are approximately normal, you’re good even with small samples.
- If either sample is under 30, inspect both sample distributions.
Acceptable:
- roughly symmetric
- moderately skewed
- no outliers
Concerning:
- strong skewness
- outliers
How to Set Up the Test on the Exam
A strong setup usually looks like this:
- State that the response variable is quantitative and the groups are independent.
- Name the procedure. Two-sample -test for a difference between two population means.
- Define and in full context.
- Write and with the correct direction.
- Check Randomization, 10%, and Sample Data using the actual study details.
If the question only asks for setup, stop there. Don’t drift into test statistic, degrees of freedom, or -value unless asked.
What Students Mix Up
- using this test for paired data
- forgetting the response variable has to be quantitative
- saying “means are different” without naming the populations and variable
- checking 10% for only one sample
- treating 10% as a normality check
- claiming equal standard deviations are required
- choosing the direction of after seeing the sample means
- doing calculations when only setup was asked for
Key Takeaways
Two-Sample t-Test for a Difference Between Two Population Means
Test for a difference between two population means using a quantitative response from two independent groups when population standard deviations are unknown
μ1 and μ2
μ1 and μ2 are the population mean values of the quantitative response variable for population 1 and population 2, defined in context
Order of Subtraction
Choose an order such as μ1 - μ2 and keep that same order in the parameter definitions, hypotheses, sample difference x̄1 - x̄2, and conclusion
Null Hypothesis for Two Population Means
H₀: μ1 - μ2 = 0, equivalently H₀: μ1 = μ2
Two-Sided Alternative Hypothesis for Two Population Means
Hₐ: μ1 - μ2 ≠ 0, equivalently Hₐ: μ1 ≠ μ2; used when asking whether the means are different
Right-Sided Alternative Hypothesis for Two Population Means
Hₐ: μ1 - μ2 > 0, equivalently Hₐ: μ1 > μ2; used when asking whether population 1 has the greater mean
Left-Sided Alternative Hypothesis for Two Population Means
Hₐ: μ1 - μ2 < 0, equivalently Hₐ: μ1 < μ2; used when asking whether population 1 has the smaller mean
Equality Goes in the Null Hypothesis
The null uses =, not >, <, or ≠; inequalities belong in the alternative hypothesis
Hypotheses Use Population Parameters, Not Sample Statistics
Write hypotheses with μ1 and μ2, not with x̄1 and x̄2
Randomization Condition
Data come from two independent random samples or from a randomized experiment with treatments randomly assigned
10% Condition
When sampling without replacement, each sample must be no more than 10% of its population: n1 ≤ 0.10N1 and n2 ≤ 0.10N2; not needed for a randomized experiment
Sample Data Condition
Both samples must have n at least 30, or both populations are approximately normal; if either sample size is less than 30, both sample distributions should be free of strong skewness and outliers
Independent Groups vs. Matched Pairs
Two-sample t-tests are for independent groups; matched-pairs data use differences within pairs and then a one-sample t-test for the mean difference
Means vs. Proportions
Use a two-sample t-test when comparing population means for a quantitative variable; success/failure data use a two-sample z-test for a difference between proportions
No Equal-Variance Requirement
A two-sample t-test does not require equal sample sizes or equal population variances; the AP procedure does not pool the sample variances
Notes
Two-Sample t-Test for a Difference Between Two Population Means
Test for a difference between two population means using a quantitative response from two independent groups when population standard deviations are unknown
μ1 and μ2
μ1 and μ2 are the population mean values of the quantitative response variable for population 1 and population 2, defined in context
Order of Subtraction
Choose an order such as μ1 - μ2 and keep that same order in the parameter definitions, hypotheses, sample difference x̄1 - x̄2, and conclusion
Null Hypothesis for Two Population Means
H₀: μ1 - μ2 = 0, equivalently H₀: μ1 = μ2
Two-Sided Alternative Hypothesis for Two Population Means
Hₐ: μ1 - μ2 ≠ 0, equivalently Hₐ: μ1 ≠ μ2; used when asking whether the means are different
Right-Sided Alternative Hypothesis for Two Population Means
Hₐ: μ1 - μ2 > 0, equivalently Hₐ: μ1 > μ2; used when asking whether population 1 has the greater mean
Left-Sided Alternative Hypothesis for Two Population Means
Hₐ: μ1 - μ2 < 0, equivalently Hₐ: μ1 < μ2; used when asking whether population 1 has the smaller mean
Equality Goes in the Null Hypothesis
The null uses =, not >, <, or ≠; inequalities belong in the alternative hypothesis
Hypotheses Use Population Parameters, Not Sample Statistics
Write hypotheses with μ1 and μ2, not with x̄1 and x̄2
Randomization Condition
Data come from two independent random samples or from a randomized experiment with treatments randomly assigned
10% Condition
When sampling without replacement, each sample must be no more than 10% of its population: n1 ≤ 0.10N1 and n2 ≤ 0.10N2; not needed for a randomized experiment
Sample Data Condition
Both samples must have n at least 30, or both populations are approximately normal; if either sample size is less than 30, both sample distributions should be free of strong skewness and outliers
Independent Groups vs. Matched Pairs
Two-sample t-tests are for independent groups; matched-pairs data use differences within pairs and then a one-sample t-test for the mean difference
Means vs. Proportions
Use a two-sample t-test when comparing population means for a quantitative variable; success/failure data use a two-sample z-test for a difference between proportions
No Equal-Variance Requirement
A two-sample t-test does not require equal sample sizes or equal population variances; the AP procedure does not pool the sample variances
