Topic 3.7 Notes – Carrying Out a Test for a Population Proportion
What a One-Sample z-Test for a Population Proportion Does
This test is for a categorical variable with two outcomes, usually called success and failure. “Success” just means the response you care about.
If successes are observed in a sample of size , then the sample proportion is
The parameter is , the true population proportion with the response of interest. On an FRQ, name it in context, like “the true proportion of all voters in the county who support the bond measure.”
The null model says assume
is true. Then ask whether your observed would be unusual under that assumption.
You should know the three possible alternatives together:
- right-tailed
- left-tailed
- two-tailed
If a problem writes the null with an inequality, like , the actual test is still done at the boundary, so use .
Conditions and the Null Distribution
Before doing the math, check whether the test is justified.
- Randomization
The data should come from a random sample or some randomized collection method. Quote the prompt, like “a simple random sample of 150 students was selected.” - Independence
If sampling without replacement, use the 10% condition. You need . - Normality under the null
Use the null value , not , for expected counts:
That use of matters because the whole test is built assuming is true. So the null distribution of has
Think of it as a normal curve centered at the null value, with spread based on and .
A very common mistake is using in the standard deviation. That belongs to a confidence interval, not this test.
Carrying Out the Test
Here’s the full calculation flow.
Identify the procedure.
This is a one-sample -test for a population proportion.Compute the sample proportion.
Suppose 118 of 250 households compost. ThenCalculate the test statistic.
If testing ,A positive means . A negative means . Bigger distance from 0 means stronger evidence against .
Find the p-value from the standard normal curve, using the alternative:
- right-tailed:
- left-tailed:
- two-tailed:
The sketch below is just a reminder that the p-value comes from the tail area that matches . For this example, focus on the left panel since this is a right-tailed test.
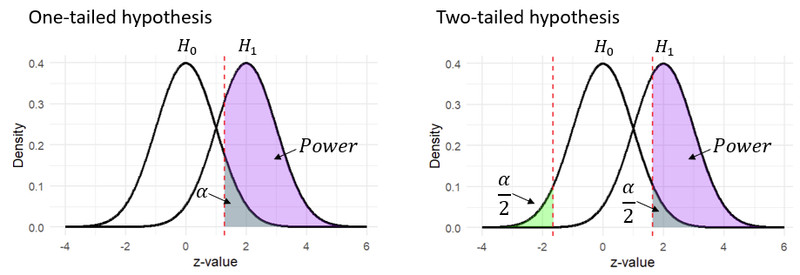
For in a right-tailed test, the p-value is about .
Calculator output is fine, but still show the setup and correct tail. Students lose points by choosing the wrong tail, doubling when they should not, or letting the sign of change the stated .
Making the Decision and Writing the Conclusion
The significance level is the cutoff for statistical significance.
- If p-value , reject
- If p-value , fail to reject
With p-value and , reject .
That decision turns into a conclusion in context. For the compost example, say:
- “There is convincing statistical evidence that the true proportion of all city households that participate in the composting program is greater than .”
Good conclusion habits:
- mention the population
- mention the parameter
- match the direction of
- use phrases like “convincing statistical evidence” or “not convincing statistical evidence”
Never say:
- “accept ”
- “prove is true”
- “the p-value is the probability that is true”
Random sampling supports generalizing to the population. It does not give cause-and-effect by itself.
How to Organize a Full FRQ Response
A clean FRQ response usually follows State, Plan, Do, Conclude.
- State
Define . Write and in context. - Plan
Name the one-sample -test for a population proportion. Check Random, 10%, and Normality. - Do
Calculate , , and the p-value with the correct tail. - Conclude
Compare p-value to , make the decision, and write the conclusion in context.
A small p-value means the result is statistically significant. It does not automatically mean the difference is important in real life.
Key Takeaways
One-Sample Z-Test for a Population Proportion
Hypothesis test for one population proportion p using z = (p̂ - p₀)/√(p₀(1 - p₀)/n) when conditions are met
Null Hypothesis for a Proportion Test
H₀: p = p₀; if a null is first written with an inequality, the test is carried out at the boundary value p = p₀.
Alternative Hypothesis for a Proportion Test
Hₐ: p > p₀, Hₐ: p < p₀, or Hₐ: p ≠ p₀; determines which tail or tails count as evidence
Parameter p in a Proportion Test
The true proportion in the population with the response of interest; define the population and what counts as a success in context
Conditions for the One-Sample Proportion Z-Test
Randomization; 10% condition if sampling without replacement; normality under H₀: np₀ ≥ 10 and n(1 - p₀) ≥ 10
10% Condition
When sampling without replacement from a finite population, require N ≥ 10n so observations are approximately independent
Normality Condition for a Proportion Test
Under H₀, expected successes and failures must both be at least 10: np₀ ≥ 10 and n(1 - p₀) ≥ 10
Sample Proportion
p̂ = x/n, where x is the number of successes in the sample
Null Standard Deviation for p̂
√(p₀(1 - p₀)/n), the standard deviation of p̂ assuming H₀ is true
Test Statistic for a Population Proportion
z = (p̂ - p₀)/√(p₀(1 - p₀)/n); measures how many null standard deviations p̂ is from p₀.
Null Distribution
Distribution of the test statistic assuming H₀ is true; approximately standard normal when conditions are met
P-Value
Probability, assuming H₀ is true, of getting a test statistic as extreme as or more extreme than the observed value in the direction of Hₐ.
Right-Tailed P-Value
For Hₐ: p > p₀, p-value = P(Z ≥ z_obs)
Left-Tailed P-Value
For Hₐ: p < p₀, p-value = P(Z ≤ z_obs)
Two-Sided P-Value
For Hₐ: p ≠ p₀, p-value = P(Z ≤ -|z_obs|) + P(Z ≥ |z_obs|)) = 2P(Z ≥ |z_obs|)
Significance Level
α, the predetermined probability of rejecting H₀ when H₀ is true
Statistically Significant
A result is statistically significant at level α when p-value ≤ α.
Decision Rule for a Hypothesis Test
If p-value ≤ α, reject H₀; if p-value > α, fail to reject H₀.
Reject H₀
Conclude there is convincing statistical evidence to support Hₐ.
Fail to Reject H₀
Conclude there is not convincing statistical evidence to support Hₐ; this does not prove H₀ true
Conclusion in Context
State the conclusion in context about the population proportion, consistent with Hₐ, using non-definitive language such as 'there is convincing statistical evidence' or 'there is not convincing statistical evidence.'
State-Plan-Do-Conclude
State: define p and hypotheses. Plan: identify a one-sample z-test and check conditions. Do: calculate p̂, z, and p-value. Conclude: compare p-value to α, make the decision, and state the conclusion in context
Statistical Significance vs. Practical Importance
A small p-value shows evidence against H₀, not whether the difference is important in real-world terms
Randomization Condition
Data should come from a random sample of the population
Notes
One-Sample Z-Test for a Population Proportion
Hypothesis test for one population proportion p using z = (p̂ - p₀)/√(p₀(1 - p₀)/n) when conditions are met
Null Hypothesis for a Proportion Test
H₀: p = p₀; if a null is first written with an inequality, the test is carried out at the boundary value p = p₀.
Alternative Hypothesis for a Proportion Test
Hₐ: p > p₀, Hₐ: p < p₀, or Hₐ: p ≠ p₀; determines which tail or tails count as evidence
Parameter p in a Proportion Test
The true proportion in the population with the response of interest; define the population and what counts as a success in context
Conditions for the One-Sample Proportion Z-Test
Randomization; 10% condition if sampling without replacement; normality under H₀: np₀ ≥ 10 and n(1 - p₀) ≥ 10
10% Condition
When sampling without replacement from a finite population, require N ≥ 10n so observations are approximately independent
Normality Condition for a Proportion Test
Under H₀, expected successes and failures must both be at least 10: np₀ ≥ 10 and n(1 - p₀) ≥ 10
Sample Proportion
p̂ = x/n, where x is the number of successes in the sample
Null Standard Deviation for p̂
√(p₀(1 - p₀)/n), the standard deviation of p̂ assuming H₀ is true
Test Statistic for a Population Proportion
z = (p̂ - p₀)/√(p₀(1 - p₀)/n); measures how many null standard deviations p̂ is from p₀.
Null Distribution
Distribution of the test statistic assuming H₀ is true; approximately standard normal when conditions are met
P-Value
Probability, assuming H₀ is true, of getting a test statistic as extreme as or more extreme than the observed value in the direction of Hₐ.
Right-Tailed P-Value
For Hₐ: p > p₀, p-value = P(Z ≥ z_obs)
Left-Tailed P-Value
For Hₐ: p < p₀, p-value = P(Z ≤ z_obs)
Two-Sided P-Value
For Hₐ: p ≠ p₀, p-value = P(Z ≤ -|z_obs|) + P(Z ≥ |z_obs|)) = 2P(Z ≥ |z_obs|)
Significance Level
α, the predetermined probability of rejecting H₀ when H₀ is true
Statistically Significant
A result is statistically significant at level α when p-value ≤ α.
Decision Rule for a Hypothesis Test
If p-value ≤ α, reject H₀; if p-value > α, fail to reject H₀.
Reject H₀
Conclude there is convincing statistical evidence to support Hₐ.
Fail to Reject H₀
Conclude there is not convincing statistical evidence to support Hₐ; this does not prove H₀ true
Conclusion in Context
State the conclusion in context about the population proportion, consistent with Hₐ, using non-definitive language such as 'there is convincing statistical evidence' or 'there is not convincing statistical evidence.'
State-Plan-Do-Conclude
State: define p and hypotheses. Plan: identify a one-sample z-test and check conditions. Do: calculate p̂, z, and p-value. Conclude: compare p-value to α, make the decision, and state the conclusion in context
Statistical Significance vs. Practical Importance
A small p-value shows evidence against H₀, not whether the difference is important in real-world terms
Randomization Condition
Data should come from a random sample of the population
