Topic 4.10 Notes – Carrying Out a Test for the Difference Between Two Population Means
What a Two-Sample t-Test for a Difference in Means Does
This test compares two independent groups. The groups might be two populations from random samples, or two treatments from a randomized experiment.
- The variable must be quantitative.
- The parameter you care about is the difference in population means, .
- The sample statistic is the difference in sample means, .
A usual null hypothesis says there is no difference:
- same idea as
The alternative depends on the question:
Because the population standard deviations are unknown, this uses sample standard deviations and , so it is a t-test.
One fast warning that shows up all the time on tests: this is only for independent groups. If the data are paired, like before/after or twins, you turn each pair into a difference and do a one-sample t-test on those differences.
Also, the subtraction order must stay fixed. If you define , every statistic and conclusion must match that order.
When the Test Is Appropriate
Both groups have to meet the conditions. One solid group does not rescue a bad one.
Randomization
You need either:
- two independent random samples, or
- a randomized experiment with random assignment to treatments
On the AP exam, saying “the samples are independent” is too vague by itself. Say how the data were collected.
Independence
For random samples taken without replacement, check the 10% condition for both groups:
That condition is not needed in a randomized experiment.
Sample data condition
The t-procedure is okay if:
- both populations are approximately normal, or
- both sample sizes are at least 30, or
- with small samples, both groups show no strong skewness and no outliers on separate graphs
That is why side-by-side boxplots are so helpful here. You are checking each group for overall shape and any clear outliers before using the test.
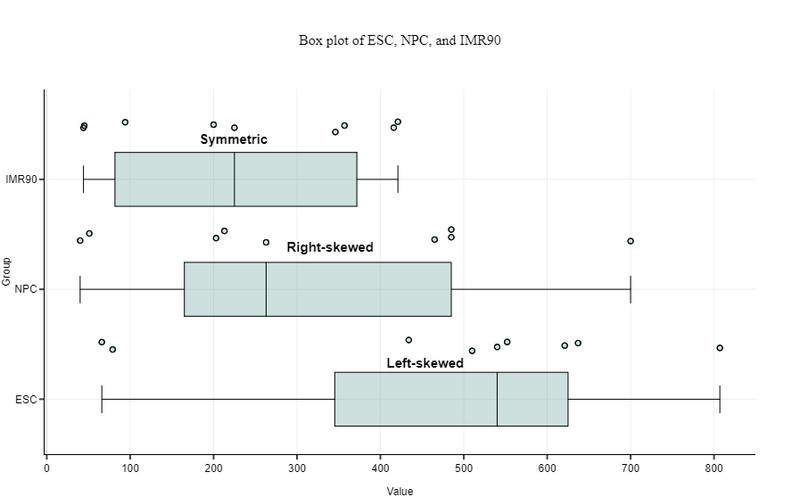
Boxplots showing skewness and outliers
Carrying Out the Test
A full test has a standard flow.
Define the parameters in context
Example: = the mean battery life for all phones using Brand A, and = the mean battery life for all phones using Brand B.Write hypotheses using population means, never sample means.
Name the procedure
Two-sample t-test for a difference between population means.Compute the standard error
The variances add because the samples are independent. This is unpooled, so on a calculator use pooled = No.
Compute the test statistic
Example with and :
A positive means group 1’s sample mean is above group 2’s.
Get df from technology
In AP Stats, df is usually not .Find the p-value from the correct tail(s).
This depends on your alternative hypothesis. A one-sided test puts all the area in one tail. A two-sided test splits the area between both tails, like the comparison shown here.
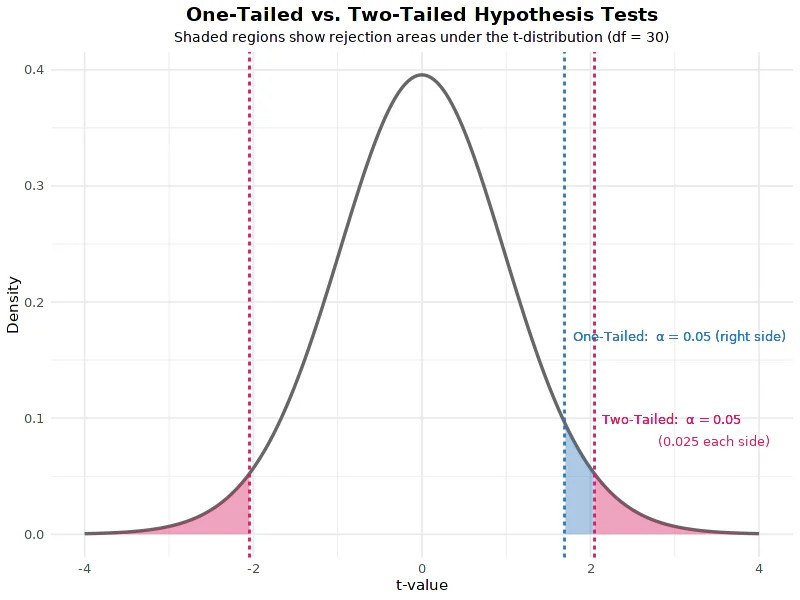
One-tailed vs. two-tailed t-tests
Interpreting the p-Value and Making the Decision
The p-value is the probability of getting a sample difference at least as extreme as the one observed, in the direction of , assuming is true.
In context, that means assuming the two population means are equal.
If , reject .
If , fail to reject .
Your conclusion must:
- mention population means
- match the direction of
- use AP wording like “convincing statistical evidence”
Example conclusion:
“There is convincing statistical evidence that the population mean battery life for phones using Brand A differs from the population mean battery life for phones using Brand B.”
Random samples let you generalize to populations. Random assignment lets you talk about cause and effect. Statistical significance does not automatically mean the difference is important in real life.
Common Mistakes to Catch Fast
- Using this test for matched pairs data
- Switching from to
- Writing hypotheses with and instead of and
- Using pooled procedures or automatically using
- Using the wrong standard error formula
- Picking the wrong tail for the p-value
- Saying “accept ”
- Saying a nonsignificant result proves the means are equal
- Writing a conclusion about the samples instead of the population means
Key Takeaways
Two-Sample t-Test for a Difference Between Population Means
Inference procedure for comparing μ1 − μ2 using two independent samples or independently assigned treatments when population standard deviations are unknown
Difference Between Population Means
Parameter of interest: μ1 − μ2, where μ1 and μ2 are the two population means
Difference Between Sample Means
Statistic for this procedure: x̄1 − x̄2
Null Hypothesis for Two Population Means
Usually H₀: μ1 − μ2 = 0, equivalently H₀: μ1 = μ2
Alternative Hypothesis for Two Population Means
Ha can be μ1 − μ2 ≠ 0, μ1 − μ2 > 0, or μ1 − μ2 < 0, depending on the investigative question
Order of Subtraction
Keep the same order in parameter, sample statistic, and test statistic; reversing order changes the sign and can change the tail for a one-sided test
Independent Samples Requirement
The two samples or treatment groups must be independent; matched pairs are not analyzed with a two-sample t-test
Randomization Condition
Data must come from two independent random samples or from a randomized experiment with random assignment to treatments
10% Condition
For random samples taken without replacement, each sample size must be no more than 10% of its population size: n1 ≤ 0.10N1 and n2 ≤ 0.10N2
Sample Data Condition
The distribution of x̄1 − x̄2 can be modeled reasonably well by a normal distribution if both population distributions are approximately normal, or both n1 and n2 are at least 30, or if either sample is small, both sample distributions show no strong skewness or outliers
Standard Error of x̄1 − x̄2
SE = √(s1²/n1 + s2²/n2), the estimated standard deviation of the sampling distribution of x̄1 − x̄2
Unpooled Standard Error
The AP Statistics two-sample t procedure does not assume equal population variances, so it uses separate sample variances rather than a pooled estimate
Two-Sample t Test Statistic
t = [(x̄1 − x̄2) − Δ0] / √(s1²/n1 + s2²/n2); for H₀: μ1 − μ2 = 0, t = (x̄1 − x̄2) / √(s1²/n1 + s2²/n2)
Degrees of Freedom for a Two-Sample t-Test
Use technology for df; it may be noninteger and falls between min(n1 − 1, n2 − 1) and n1 + n2 − 2
Conservative Degrees of Freedom
If technology is unavailable, use df = min(n1 − 1, n2 − 1); this is conservative because it generally gives a larger p-value
p-Value for a Two-Sample t-Test
Probability, assuming H₀ is true, of getting a test statistic as extreme or more extreme than the observed one in the direction of Hₐ; here that means assuming the two population means are equal in context
Right-Tailed, Left-Tailed, and Two-Sided p-Values
For Ha: μ1 − μ2 > 0, use area right of t; for Ha: μ1 − μ2 < 0, use area left of t; for Ha: μ1 − μ2 ≠ 0, use both tails beyond ±|t|.
Formal Decision Rule
Compare the p-value to α: if p-value ≤ α, reject H₀; if p-value > α, fail to reject H₀.
Conclusion in Context
State in context whether there is or is not convincing statistical evidence about the population means, consistent with Hₐ, referring to the parameters and populations and using non-definitive language
Scope of Inference for Two-Sample t-Tests
Independent random samples allow generalization to the populations; random assignment in an experiment allows cause-and-effect conclusions about the treatments
Notes
Two-Sample t-Test for a Difference Between Population Means
Inference procedure for comparing μ1 − μ2 using two independent samples or independently assigned treatments when population standard deviations are unknown
Difference Between Population Means
Parameter of interest: μ1 − μ2, where μ1 and μ2 are the two population means
Difference Between Sample Means
Statistic for this procedure: x̄1 − x̄2
Null Hypothesis for Two Population Means
Usually H₀: μ1 − μ2 = 0, equivalently H₀: μ1 = μ2
Alternative Hypothesis for Two Population Means
Ha can be μ1 − μ2 ≠ 0, μ1 − μ2 > 0, or μ1 − μ2 < 0, depending on the investigative question
Order of Subtraction
Keep the same order in parameter, sample statistic, and test statistic; reversing order changes the sign and can change the tail for a one-sided test
Independent Samples Requirement
The two samples or treatment groups must be independent; matched pairs are not analyzed with a two-sample t-test
Randomization Condition
Data must come from two independent random samples or from a randomized experiment with random assignment to treatments
10% Condition
For random samples taken without replacement, each sample size must be no more than 10% of its population size: n1 ≤ 0.10N1 and n2 ≤ 0.10N2
Sample Data Condition
The distribution of x̄1 − x̄2 can be modeled reasonably well by a normal distribution if both population distributions are approximately normal, or both n1 and n2 are at least 30, or if either sample is small, both sample distributions show no strong skewness or outliers
Standard Error of x̄1 − x̄2
SE = √(s1²/n1 + s2²/n2), the estimated standard deviation of the sampling distribution of x̄1 − x̄2
Unpooled Standard Error
The AP Statistics two-sample t procedure does not assume equal population variances, so it uses separate sample variances rather than a pooled estimate
Two-Sample t Test Statistic
t = [(x̄1 − x̄2) − Δ0] / √(s1²/n1 + s2²/n2); for H₀: μ1 − μ2 = 0, t = (x̄1 − x̄2) / √(s1²/n1 + s2²/n2)
Degrees of Freedom for a Two-Sample t-Test
Use technology for df; it may be noninteger and falls between min(n1 − 1, n2 − 1) and n1 + n2 − 2
Conservative Degrees of Freedom
If technology is unavailable, use df = min(n1 − 1, n2 − 1); this is conservative because it generally gives a larger p-value
p-Value for a Two-Sample t-Test
Probability, assuming H₀ is true, of getting a test statistic as extreme or more extreme than the observed one in the direction of Hₐ; here that means assuming the two population means are equal in context
Right-Tailed, Left-Tailed, and Two-Sided p-Values
For Ha: μ1 − μ2 > 0, use area right of t; for Ha: μ1 − μ2 < 0, use area left of t; for Ha: μ1 − μ2 ≠ 0, use both tails beyond ±|t|.
Formal Decision Rule
Compare the p-value to α: if p-value ≤ α, reject H₀; if p-value > α, fail to reject H₀.
Conclusion in Context
State in context whether there is or is not convincing statistical evidence about the population means, consistent with Hₐ, referring to the parameters and populations and using non-definitive language
Scope of Inference for Two-Sample t-Tests
Independent random samples allow generalization to the populations; random assignment in an experiment allows cause-and-effect conclusions about the treatments
